
Why Continuous Improvement Drives ROI
March 11, 2026Want better ROI from marketing? Continuous improvement is the answer. Instead of risky overhauls or expensive campaigns, this method focuses on small, data-driven changes that deliver measurable results over time. Inspired by the "Kaizen" philosophy, continuous improvement follows the PDCA cycle: Plan, Do, Check, and Act. Here's why it works:
- Higher ROI: Small optimizations can boost conversion rates up to 5x, with top websites achieving 11.45% compared to the 2.35% average.
- Revenue Growth: Leading companies using this approach see up to 70% higher revenue growth.
- Better Budget Use: Tools like Marketing Mix Modeling (MMM) and Multi-Touch Attribution (MTA) help reallocate budgets 25% more effectively, improving ROI by 15–20%.
- Iterative Testing: Running more experiments (500+ annually for top performers) leads to faster insights and better results.
Continuous improvement turns marketing into an ongoing experiment, ensuring every dollar works harder. By tracking key metrics like Customer Lifetime Value (CLV) and refining strategies regularly, businesses can achieve sustainable growth and long-term profitability.
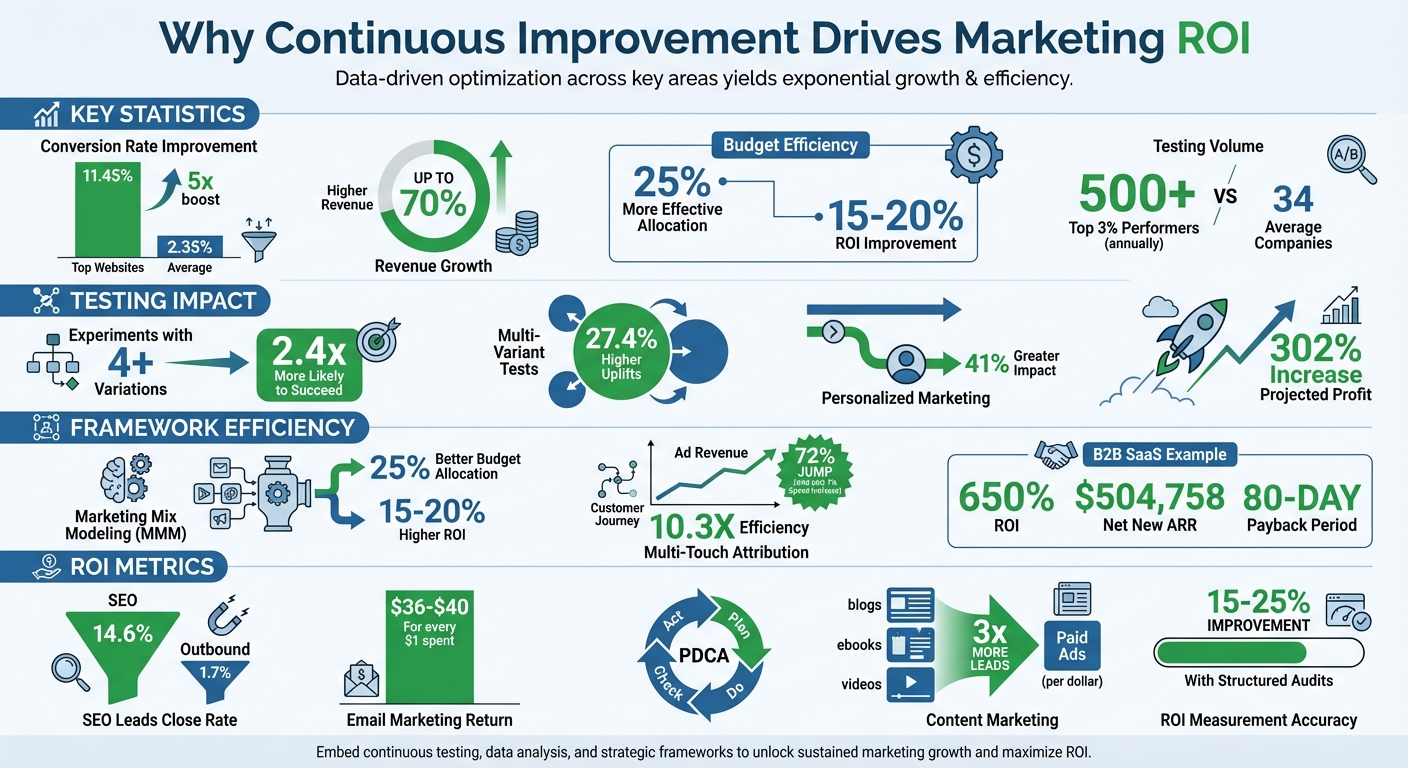
Continuous Improvement Marketing ROI Statistics and Impact
How to Maximise the ROI from Process Analysis and Improvement
sbb-itb-cef5bf6
Research Findings: Continuous Improvement and ROI
Businesses that prioritize continuous improvement see impressive revenue growth. Studies reveal that top-performing marketing organizations achieve up to 70% higher revenue growth compared to their competitors. What sets these leaders apart? They rely on standardized KPI frameworks and advanced measurement tools instead of intuition or outdated metrics. These findings align directly with the continuous improvement framework, showcasing its powerful effect on ROI.
Revenue Growth Through Strategy Optimization
The most successful companies don’t just measure - they measure smarter. Top marketers use what’s called the "Measurement Trifecta":
- Marketing Mix Modeling (MMM) for strategic planning
- Incrementality testing for understanding cause-and-effect
- Multi-Touch Attribution (MTA) for optimizing daily performance
This combined approach provides a well-rounded view of campaign performance. By leveraging first-party data and attribution insights, companies can improve marketing spend efficiency by 20%. One study even found that continuous testing and optimization led to a 302% increase in projected profit - all without increasing marketing budgets.
Better Conversion Rates Through Iterative Testing
When it comes to testing, more variation equals better results. Research shows that experiments with four or more variations are 2.4 times more likely to succeed and deliver 27.4% higher uplifts than basic A/B tests. Personalized marketing also makes a big difference, driving a 41% greater impact compared to generic approaches.
The contrast in testing frequency is striking. While the average company runs about 34 experiments annually, the top 3% of high performers conduct over 500 experiments per year.
"Continuous improvement comes from continuous testing and optimization, not one-time research that lets you 'set it and forget it'".
This iterative process creates what experts call an "ROI flywheel" - a system where parallel testing accelerates insights and speeds up the deployment of winning strategies. Over time, these compounding gains fuel even greater success. Together, strategy optimization and iterative testing are the backbone of an effective continuous improvement framework.
Frameworks for Continuous Improvement in Marketing
Top marketers rely on structured frameworks to turn raw data into actionable strategies. These frameworks create a systematic approach to measuring success and ensure every marketing dollar is put to good use.
Marketing Mix Modeling and Measurement
Marketing Mix Modeling (MMM) helps identify the key drivers behind sales performance. By using regression analysis, it separates "Base Sales" (stemming from brand strength) from "Gradual Sales" (influenced by marketing campaigns). This separation allows marketers to pinpoint which efforts actively drive sales instead of simply benefiting from existing brand momentum.
A well-rounded approach to measurement often includes the "four-legged stool":
- Modeling: Using MMM to uncover strategic trends.
- Testing: Running incremental lift tests to establish cause-and-effect relationships.
- Insights: Leveraging multi-touch attribution (MTA) to map the customer journey.
- Metrics: Tracking real-time performance indicators like CPA (Cost Per Acquisition) and ROAS (Return on Ad Spend).
MMM also identifies when marketing channels hit their saturation point - where additional spending stops delivering returns. Businesses using MMM typically reallocate budgets 25% more effectively and achieve 15–20% higher ROI.
While MMM provides a high-level view, diving deeper into individual touchpoints can sharpen campaign strategies even more.
Multi-Touch Attribution Models
Unlike last-click attribution, Multi-Touch Attribution (MTA) spreads credit across all touchpoints that influence a conversion. This matters because poor data visibility and reliance on last-click attribution waste nearly half (47%) of marketing budgets.
Different MTA models cater to various needs:
- The U-Shaped model gives 40% credit to the first and last touchpoints, with 20% distributed among middle interactions - ideal for lead generation.
- The W-Shaped model allocates 30% each to the first touch, lead creation, and final conversion, making it effective for complex B2B sales cycles.
- Data-driven attribution uses advanced algorithms like Shapley Value or Markov Chains to assign credit based on the statistical likelihood of conversion.
A great example is Billy Footwear. By adopting MTA with first-party tracking, the company shifted its budget from overperforming email campaigns to underutilized Instagram awareness ads. This adjustment led to a 72% jump in ad revenue year-over-year, achieved with just a 7% increase in ad spend - a 10.3X efficiency boost.
Beyond understanding touchpoints, focusing on customer longevity can further refine marketing strategies.
Customer Lifetime Value (CLV) Analysis
CLV analysis is essential for assessing long-term profitability. Instead of prioritizing one-off sales, CLV considers repeat purchases, upgrades, and the total revenue a customer generates over their lifetime. This shifts the perspective of marketing from being a cost to a significant value driver.
For B2B SaaS companies, CLV also helps monitor payback periods - the time it takes for marketing investments to break even. Many top-performing companies achieve payback periods as short as 80 days. For instance, in 2025–2026, TripMaster - a B2B SaaS firm - generated $504,758 in Net New ARR in a single year by implementing a disciplined CRO strategy paired with LTV-focused attribution. This approach delivered an impressive 650% ROI.
"Improving ROI by knowing your customer lifetime value (CLV) can help you better align your spend with the highest margin prospects." – Bluprintx
Metrics for Measuring Marketing Optimization
Metrics are the backbone of effective marketing strategies, transforming vague efforts into actionable insights. Yet, 63% of businesses struggle to measure the success of their content marketing, and only 21% of marketers can confidently link content performance to revenue. This disconnect often arises from inadequate attribution systems that fail to map the entire customer journey. Reliable metrics not only help quantify success but also fuel the ongoing tweaks needed to enhance ROI.
For example, awareness content should be evaluated based on impressions and organic clicks, while conversion-focused content must demonstrate its impact through sales and revenue attribution. In B2B marketing, 40–60% of conversions are "assisted," meaning they involve multiple content interactions before a final decision is made. Understanding this journey is critical. Below, we’ll explore how to measure content performance and conversions to refine your strategy.
Content Performance Metrics
Content performance hinges on visibility and engagement. Metrics like organic impressions and search visibility scores indicate whether your content is reaching its intended audience [36,38]. Once it’s visible, click-through rates (CTR) reveal how enticing your titles and meta descriptions are. For instance, the top search result typically garners 28–32% of clicks, while those below the fold often receive less than 2%.
Engagement metrics dig deeper, assessing how well your content aligns with user intent. Tools like GA4 replace traditional bounce rates with "Engaged Sessions" and "Engagement Rate" for a more accurate picture of user satisfaction [37,38]. Additionally, tracking scroll depth at intervals like 25%, 50%, 75%, and 90% - alongside average engagement time - can help identify which content resonates most [35,36]. Custom events, such as measuring 75% scroll depth or 3 minutes on a page, highlight high-quality traffic more likely to convert.
Looking ahead, businesses must also keep an eye on AI referral traffic from tools like ChatGPT and Claude, as well as AI platform citations, to gauge their visibility in AI-driven search results. With 48% of companies reporting declines in organic traffic from 2024 to 2025 due to AI search, tracking these new metrics is becoming essential.
While these metrics capture audience behavior, conversion metrics reveal how well those interactions translate into revenue.
Conversion and ROI Metrics
Conversion metrics are the key to fine-tuning strategies that maximize ROI. At its core, the marketing ROI formula is simple: ((Net Profit from Marketing / Marketing Investment) × 100%). However, reaching that number requires monitoring several supporting metrics.
Start with conversion rate optimization (CRO), which measures how effectively visitors turn into leads or customers [39,41]. Metrics like Customer Lifetime Value (CLV) and Customer Acquisition Cost (CAC) reveal acquisition efficiency. Aim for an LTV:CAC ratio of 3:1 to ensure sustainable growth; anything below 2:1 signals inefficiency, while ratios above 5:1 may indicate missed growth opportunities [37,42,43].
Don’t overlook micro-conversions - actions like downloads, newsletter signups, or webinar registrations. These smaller steps are critical indicators of how top-of-funnel content supports eventual sales [35,41]. For B2B marketers, using attribution windows of at least 90 days helps capture the extended sales cycles typical in this space.
"SEO should ultimately be about revenue. Just like every other marketing channel." – Ken Marshall, Chief Growth Officer, RevenueZen
The data supports this approach: SEO leads close at a rate of 14.6%, compared to just 1.7% for outbound leads. Similarly, email marketing delivers an average ROI of $36 to $40 for every $1 spent [41,43], and content marketing generates three times more leads per dollar than paid ads. These benchmarks can guide your efforts toward measurable, continuous improvement.
How to Implement Continuous Improvement
Knowing your metrics is one thing, but applying them effectively is where the magic happens. Here's a telling statistic: 61% of highly successful companies perform two or more marketing audits each year. Even more compelling, organizations that use structured campaign performance audits often enjoy 15–25% increases in marketing ROI. The key difference between campaigns that plateau and those that thrive often boils down to three essential practices: conducting a comprehensive audit, analyzing the real impact of each tactic, and establishing a habit of regular reviews.
Perform an Initial Audit
Start with a focused 10-to-15-day audit sprint. The goal? To measure customer value, cash payback, and channel-level profitability - not just surface metrics like clicks or leads. Pull data from your CRM, ad platforms, email tools, and analytics, and bring it all together in a unified dashboard. This eliminates data silos and reduces blind spots that could distort your ROI calculations.
Before diving into analytics, set SMART objectives by aligning key performance indicators (KPIs) like Customer Acquisition Cost (CAC) and revenue growth with actual marketing outcomes. Compare your internal data to industry benchmarks. For example, B2B tech engagement typically lands between 15–18%. Look for "opportunity gaps" and flag segments with an LTV:CAC ratio below 2:1 or a long payback period for immediate attention. Establishing this baseline is crucial for making meaningful and ongoing improvements to your marketing strategies.
Use Contribution Analysis
Not every tactic pulls its weight equally when it comes to ROI. In fact, 80% of online purchases involve multiple touchpoints, so relying on last-click attribution alone won't cut it. Multi-touch attribution (MTA) offers a more accurate picture by distributing credit across all significant interactions. This approach often improves ROI measurement accuracy by 15–25% compared to last-click models.
Dig deeper by analyzing ROI at a more granular level - think specific combinations of channels, personas, creative assets, and geographic regions - rather than relying on broad averages that can mask inefficiencies. Partner with your finance team to align on shared formulas for metrics like LTV, CAC, and Payback Period. This ensures consistency and builds trust at the executive level.
Here’s a simple framework for reallocating resources:
- Cut segments with an LTV:CAC ratio below 2:1.
- Optimize segments with ratios between 2:1 and 3:1 through testing.
- Scale up segments with ratios above 3.5:1.
When calculating ROI, use gross margin-adjusted revenue to align with your finance team’s standards. Once you've identified underperforming and high-performing segments, create a formal system for ongoing evaluation.
Set Up Regular Review Cycles
Sustained improvement requires regular check-ins. Schedule weekly ROI meetings with teams from Marketing, RevOps, and Finance to review current performance and adjust budgets based on the latest data. These meetings shift your approach from reactive to proactive, enabling smarter, data-driven decisions.
Keep an improvement log where you document details like the date, the area tested, the metrics involved, your hypothesis, the results, and the next steps. This log turns casual observations into a structured resource and helps avoid repeating past mistakes. To streamline reporting, standardize naming conventions for campaigns and UTM parameters - for example, {Year}_{Quarter}_{Campaign-Type}.
Finally, adopt the PDCA (Plan-Do-Check-Act) cycle to turn small, incremental changes into a reliable growth engine. Each review cycle builds on the last, creating a system where improvement becomes second nature.
Conclusion
Turning marketing expenses into measurable profit hinges on a commitment to continuous improvement. Businesses that embrace data-driven strategies and advanced attribution models see ROI measurements improve by 15–25% in accuracy. The difference between campaigns that merely survive and those that excel lies in viewing marketing as an ongoing experiment rather than a static, one-and-done effort.
Small, consistent adjustments - like tweaking email subject lines, fine-tuning ad targeting, or refining landing pages - can lead to significant growth over time. These incremental gains, even as small as 1%, add up and make a noticeable impact when compounded.
This approach also shifts the focus from vanity metrics to genuine profitability. By analyzing metrics like Customer Lifetime Value (CLV) and reallocating budgets from underperforming segments (with an LTV:CAC ratio below 2:1) to high-performing ones (above 3.5:1), businesses can make decisions based on financial outcomes instead of intuition.
"If CMOs can assign a true ROI to Marketing cost, they can inspire confidence in the decision-making process for marketing allocation, even in trying times".
Data-driven adjustments don’t just boost ROI - they elevate overall marketing performance. About one in three improvements identified through continuous improvement programs directly impacts financial results. On average, these initiatives save $70,000 in their first year, with over 30% of those savings recurring annually. This compounding effect builds long-term value, whether you're optimizing conversion rates, refining attribution models, or experimenting with new creative ideas.
The key is to start where you are. Establish a baseline, document your tests, and commit to regular reviews. The most successful organizations in 2026 won’t necessarily be the ones with the deepest pockets - they’ll be the ones consistently improving their marketing investments over time.
FAQs
How do I start a PDCA cycle for my marketing?
The PDCA cycle is a structured approach to continuously improve your marketing efforts. Here's how to get started:
- Plan: Begin by defining clear objectives and measurable goals. Outline a detailed action plan that aligns with your overall marketing strategy. This stage is all about preparation and setting a solid foundation.
- Do: Put your plan into action, but start on a small scale or as a pilot program. This allows you to test your strategies without committing all resources upfront.
- Check: Once implemented, analyze the performance data. Compare the results to your original goals to understand what worked and what didn’t.
- Act: Use the insights from your analysis to refine your strategies. Make adjustments, implement improvements, and repeat the cycle for ongoing progress.
By consistently applying this process, you can fine-tune your marketing strategies and achieve better results over time, ensuring your efforts yield the highest return on investment.
When should I use MMM vs. MTA?
Multi-Touch Attribution (MTA) is a method that assigns credit to multiple touchpoints throughout the customer journey. This approach is especially useful for complex digital campaigns, as it provides detailed insights into how various channels work together to drive results. By analyzing each interaction, MTA helps you understand which touchpoints play a key role in conversions and how they contribute to the overall customer experience.
On the other hand, Marketing Mix Modeling (MMM) offers a broader view, focusing on the overall effectiveness of your marketing efforts. It evaluates the impact of media, market trends, and budget allocation over time. This method is ideal for high-level strategic planning, helping you understand how different factors influence your overall performance.
In essence, MTA is best for granular, detailed attribution, while MMM is suited for shaping long-term strategies and making informed budget decisions. Together, they provide a comprehensive view of your marketing efforts.
What’s a good LTV:CAC ratio for my business?
A good LTV:CAC ratio usually ranges between 3:1 and 5:1. This means that the lifetime value (LTV) of a customer should ideally be three to five times higher than the cost of acquiring that customer (CAC). When your ratio falls within this range, it indicates a solid balance between how much you're spending to gain customers and the profits they bring over time.