Ultimate Guide to Post-Campaign Reporting
March 4, 2026Post-campaign reporting is how you evaluate the success of your marketing efforts. It’s about turning raw data into actionable insights that can improve future campaigns and prove your return on investment (ROI). Here’s what you need to know:
- Why It Matters: It helps justify marketing spend, identifies what worked (and what didn’t), and supports better budget allocation for future campaigns. Data-driven companies are 23x more effective at acquiring customers and 19x more likely to sustain profitability.
- Key Metrics: Focus on ROI, ROAS (Return on Ad Spend), conversion rate, CPA (Cost Per Acquisition), CLV (Customer Lifetime Value), and engagement rates like CTR (Click-Through Rate). These metrics tie campaign performance directly to business outcomes.
- Measurement Tips: Use SMART goals, UTM parameters, and tools like GA4 to ensure accurate tracking. Avoid overly simplistic attribution models; instead, use multi-touch or position-based models for a complete picture.
- Reporting Process: Start with clear objectives, collect and standardize data, analyze performance, visualize results with tools like Looker Studio, and provide actionable recommendations.
- Data Visualization: Use bar charts, line graphs, or pie charts to make data easier to understand. Avoid clutter and focus on clarity.
- Lessons Learned: Document successes and failures. Use insights to refine strategies and avoid repeating mistakes.
Effective post-campaign reports don’t just summarize numbers - they connect performance to business goals and guide future strategies.
How to track marketing campaign performance | Digital Culture Network

Key Metrics for Post-Campaign Reporting
Post-Campaign Reporting Key Metrics and Performance Statistics
Core KPIs to Track
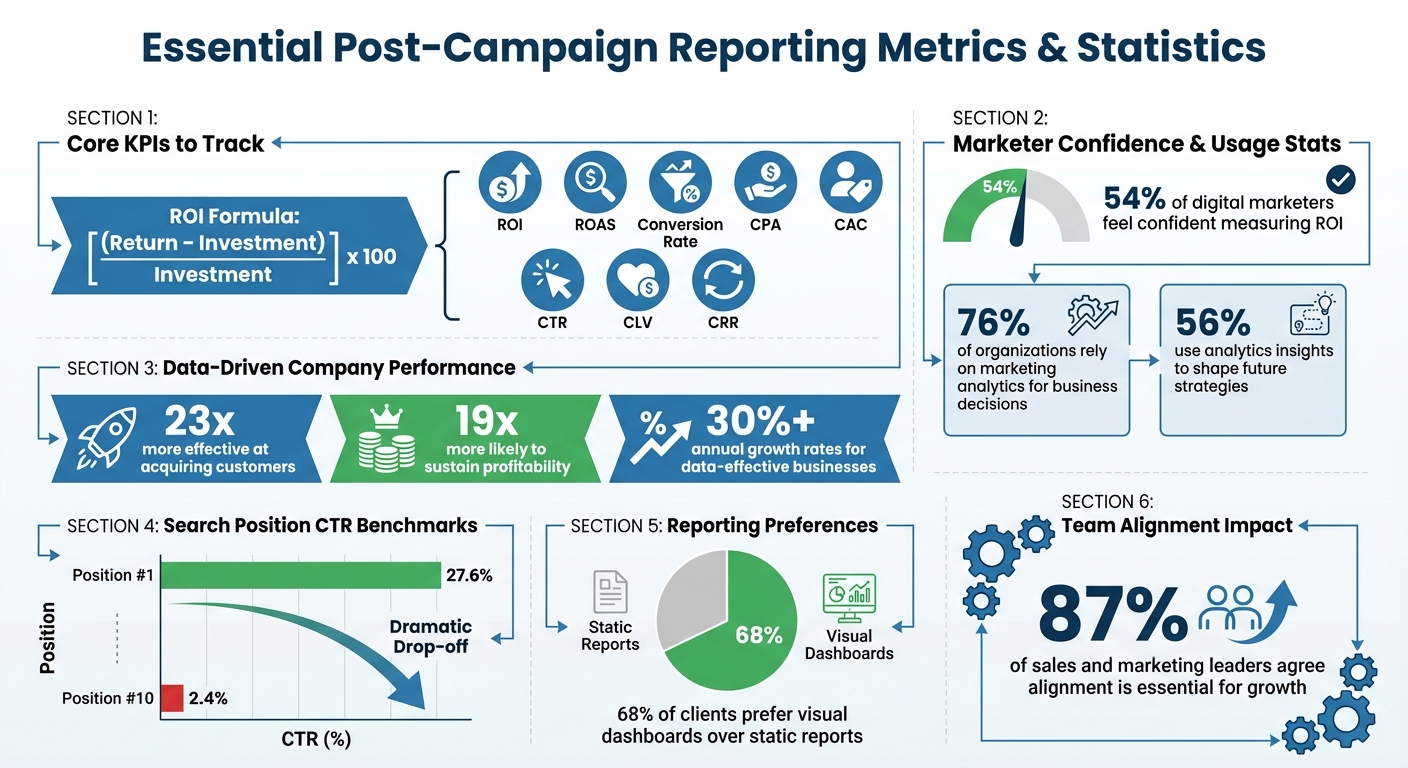
When evaluating your campaign's success, focus on KPIs that clearly demonstrate its value. Start with financial indicators like ROI and ROAS (Return on Ad Spend). ROI measures the overall return on your investment using this formula:
[(Return – Investment) / Investment] x 100.
ROAS, on the other hand, hones in on how much revenue is generated for every dollar spent on advertising.
Next, look at conversion metrics. These reveal how effectively your campaign turns interest into action. The conversion rate tells you the percentage of users completing a desired action, but it’s equally important to consider Cost Per Acquisition (CPA) and Customer Acquisition Cost (CAC). These metrics help you understand if your conversion costs are sustainable compared to the revenue each customer generates over their lifetime. A high conversion rate is meaningless if acquiring each customer costs more than their total spending with your business.
Engagement metrics like click-through rate (CTR) and overall engagement (likes, shares, comments) give insight into how well your content resonates with your audience. For example, CTR reflects how effectively your ad copy aligns with user intent. If your campaign has high impressions but a low CTR, it may indicate that your creative isn’t connecting with your target audience.
Don’t forget to track long-term value metrics. Customer Lifetime Value (CLV) and Customer Retention Rate (CRR) measure whether you’re building a loyal customer base instead of just attracting one-time buyers. Interestingly, only 54% of digital marketers feel confident in their ability to measure and report ROI accurately. However, 76% of organizations now rely on marketing analytics to guide business decisions, and 56% use these insights to shape future strategies.
"It's crucial to align your PPC metrics with your actual business goals."
– Dominik Maka, Head of SEO, LV Bet
With these KPIs in place, the next step is ensuring accurate measurement.
How to Measure Metrics
Accurate measurement starts well before your campaign goes live. Setting SMART goals - Specific, Measurable, Achievable, Relevant, and Time-bound - provides a clear baseline for comparison.
Use UTM parameters on all campaign links to track traffic sources and assign proper attribution. This tagging system makes it easier to identify which channels, campaigns, or even individual ads are driving conversions. To avoid fragmented data, integrate tools like GA4, Google Search Console, and your CRM via APIs. This ensures seamless reporting and gives you a complete picture of campaign performance.
Avoid relying solely on first-click or last-click attribution models, as they often overlook the full customer journey. Instead, consider using linear, time decay, or position-based attribution models for a more nuanced view.
Segment your data by demographics, device type, and location to identify top-performing audience groups. For long-term insights, year-over-year (YoY) comparisons are often more revealing than month-over-month (MoM) analyses, especially for seasonal businesses or SEO campaigns. For example, the #1 organic search position averages a 27.6% CTR, while position #10 drops to just 2.4%. Such context helps determine whether your campaign results are genuinely strong.
Tailor your reporting schedule to the nature of your campaign. Weekly reports work well for fast-paced PPC campaigns or during the initial 90 days of a new launch. In contrast, monthly reports are better suited for established SEO efforts, which often need 2–8 weeks to show measurable results. Tools like Looker Studio can automate dashboards, saving time on data collection and allowing your team to focus on analysis and strategy.
"CIQ gives us direct insights on campaign specifics... This allows us to get more of what is working and trim the fat on what is not."
– Rambod Yadegar, President, HawkSEM
Post-Campaign Reporting Process
Creating a post-campaign report isn't just about compiling numbers - it's about crafting a story that connects your campaign's performance to meaningful business outcomes. By following a structured process, raw data can be transformed into actionable insights.
Step 1: Define Objectives and Collect Data
Begin by revisiting your campaign's objectives. Was your aim to generate leads, build brand awareness, or drive direct sales? Clearly defining these goals ensures everyone evaluates the results with the right perspective.
Next, focus on gathering and standardizing your data. Pull in analytics from platforms like Google Ads or LinkedIn, and ensure your CRM links marketing efforts to actual revenue. Standardize naming conventions across platforms - discrepancies like "purchase_complete" versus "checkout_done" can waste hours in reconciliation. Keep in mind, data retrieval can be a time-intensive task, often requiring 4–6 hours per client each month.
Don’t forget to archive data from platforms with limited retention windows. For instance, Google Search Console only retains 16 months of historical data. These steps establish a solid foundation for analyzing the campaign's true business impact.
"The Post-Campaign Report is GOLD. Brands are always so impressed by them and often offer a second deal from that alone."
– Molly Donlan, Creator
With your data in place, you’re ready to dive into performance analysis.
Step 2: Analyze Data and Attribute Performance
Now that you’ve collected your data, it’s time to figure out which channels delivered results. Use funnel analysis to map how leads moved from initial exposure to conversion. This reveals where potential customers dropped off. For example, if 1,000 people clicked on your ad but only 50 completed the lead form, you've identified a critical point to address.
Leverage multi-touch attribution to understand how each channel contributed. Ignoring assisted conversions can undervalue a channel’s impact by as much as 30% to 50%.
Compare your campaign’s performance to previous efforts and your initial objectives. Look at patterns over 12 to 24 months to distinguish real growth from seasonal trends. For instance, a December traffic spike might stem from holiday shopping rather than your campaign. Also, remember that SEO changes often take 2 to 8 weeks to show measurable results.
"Marketing jargon is the quickest way to turn a client off reading your report, meaning you have wasted your time writing it and crucially they may not fully action or buy into your marketing strategies moving forward."
– Dave Reeder, Founding Director, Made Simple Media
Step 3: Visualize Data
Data in spreadsheets can be overwhelming. Instead, bring your findings to life with visual dashboards using tools like Looker Studio, Tableau, or Power BI. Research shows that 68% of clients prefer visual dashboards over static reports.
Use bar charts to compare channel performance and line graphs to highlight trends over time. Each visualization should answer a specific business question, focusing on one metric at a time. For executives, create a concise one-page summary that highlights business outcomes like revenue, ROI, and customer acquisition costs - something they can digest in under five minutes.
Organize your report into two key sections: a high-level executive summary and a detailed breakdown for practitioners. The executive summary should focus on outcomes, while the detailed section can dive into metrics like click-through rates and bounce rates. Include raw data and screenshots in an appendix to keep the main report clean and focused.
Step 4: Generate Recommendations
Finally, use your analysis and visualizations to inform actionable recommendations. Explain the "why" behind your results and propose specific next steps. For instance, if a webinar campaign brought in leads but had a low conversion rate, suggest refining lead qualification criteria or adjusting follow-up timing.
Be transparent about both successes and shortcomings. Acknowledging areas of underperformance builds trust and helps avoid repeating mistakes. If certain channels were more cost-effective than others, recommend reallocating budget to maximize efficiency.
Use these insights to pitch future initiatives. Highlight opportunities to scale successful tactics or test new approaches to address weak spots. Companies that effectively use data often see annual growth rates exceeding 30%.
"I'd be cautious about overcomplicating your marketing reports, keep them top-level - showing the overall performance. Drilling down too much or providing too many pages turns people off."
– Isaac Bullen, Director, 3WH
sbb-itb-cef5bf6
Data Visualization Best Practices
A well-chosen chart can transform a sea of numbers into clear, actionable insights. The trick is aligning your visualization with the story you want to tell - whether that’s tracking trends, comparing performance across channels, or breaking down budget allocations.
Data Visualization Techniques
Picking the right chart is half the battle. Line charts are perfect for showing trends over time, like tracking ROAS (Return on Ad Spend) over a three-month period. To keep things clear, limit yourself to three or four metrics per chart; too many lines can get messy and confusing. Bar charts, on the other hand, shine when comparing categories, such as performance across different marketing channels. For maximum clarity, arrange the bars by performance - highest to lowest - rather than sticking to alphabetical order.
When illustrating part-to-whole relationships, such as budget allocations, pie or donut charts can work well, but only if you’re dealing with fewer than six segments. For easier readability, start the largest segment at the 12 o’clock position. If you’re looking to show relationships between two variables, like ad spend versus revenue, scatter plots are the way to go. For more intricate patterns, like peak engagement times, heat maps make it easy to spot trends by hour or day.
Want to dig deeper? Segment your data by factors like channel, device type, or region to uncover unique trends. For executive audiences, consider using a "five-metric framework" that highlights current value, month-over-month changes, and year-over-year changes. Add simple visual cues, like green or red arrows, to make the data instantly digestible.
Some quick tips: Always start your Y-axis at zero for fair comparisons. Skip 3D effects - they tend to distort the data and make it harder to interpret accurately. Add annotations directly to your charts to highlight key moments, like "Campaign launch on 2/15" or "Algorithm update", to give your data proper context. These thoughtful touches turn raw numbers into a story that connects data to strategy.
Storytelling with Data
Data by itself can feel overwhelming. To make it meaningful, you need a narrative. A simple structure works wonders: Setup (where things started), Conflict (the challenge or opportunity), and Resolution (what was achieved and what comes next). Framing your data this way makes it easier for stakeholders to understand and remember.
Zero in on a "protagonist" metric - something that aligns with your audience’s goals. For a CEO, that might be revenue growth or customer acquisition costs. For a marketing manager, it could be channel-specific conversion rates. Tailor your story depending on who’s listening. Project managers may need detailed tactical insights, while executives usually prefer high-level KPIs and business outcomes.
"Data tells, stories sell. Weaving data into a narrative with a clear protagonist (specific metrics), antagonist (challenges faced), and a satisfying resolution (successful SEO results) creates an emotional connection with the stakeholder."
– Lazarina Stoy, SEO & ML Consultant
When crafting post-campaign reports, focus on metrics that matter. Avoid vanity stats that look impressive but don’t tie back to ROI. Instead, highlight conversion rates, lead sources, and web traffic insights - data that directly links to business outcomes. Use your visualizations as evidence to back up your story, bridging any gaps in the narrative. With marketing analytics influencing over 50% of decisions, presenting your data clearly can play a crucial role in shaping future budgets and strategies.
Lessons Learned from Campaign Performance
Analyzing campaign performance isn't just about numbers - it's about turning those numbers into actionable insights. By documenting lessons learned, you create a roadmap for smarter, more effective campaigns in the future. Post-campaign reporting does more than measure success; it builds a foundation for growth. Companies that embrace data-driven decisions often report annual growth rates of over 30%.
Identifying Success Factors
Success isn’t just about hitting numbers like impressions, CTR, or ROI. It’s also about understanding the why behind the results. Combining quantitative metrics with qualitative insights - like customer feedback - can reveal deeper trends. Funnel analysis, for example, helps identify where engagement is thriving and where it’s falling off.
Evaluating both wins and losses is key. Win/loss analysis - examining both successful and failed A/B tests - offers a comprehensive view of what resonates with your audience. Don’t overlook cross-channel interactions either. For instance, social media campaigns might boost organic search traffic, a connection that’s easy to miss when channels are analyzed in isolation. Segmenting data by factors like demographics, device type, or region can also highlight which audiences are driving the best results, enabling more precise targeting in the future.
While understanding what worked is essential, learning from what didn’t is just as critical.
Learning from Challenges
Identifying challenges isn’t just about pointing out failures - it’s about being specific and actionable. Avoid vague conclusions like “social media underperformed.” Instead, provide detailed insights: “Instagram ads had a $45 CPA compared to $12 for email, so we’re reallocating 30% of the social budget to email for Q2”. These kinds of findings empower teams to adjust strategies effectively.
If high CTRs aren’t translating to conversions, investigate potential friction points like landing pages or checkout processes. It’s also important to differentiate between revenue and profit. A campaign generating $50,000 in revenue might seem successful, but if it relied on heavy discounts and high ad spend, it could be less profitable than a $40,000 campaign with lower costs.
To make these lessons stick, consider creating a one-page retrospective after every campaign. Include details like what worked, what didn’t, and what you’ll change next time. Over time, these retrospectives build a valuable data library, helping you spot patterns in channel performance or discount strategies. Before planning any new campaign, reviewing these past insights should be step one.
"The most expensive mistake in holiday campaign measurement is not a failed campaign. It is a successful campaign you cannot replicate because you never documented what made it work."
– Muhammed Tüfekyapan, Founder, Growth Suite
Conclusion
Post-campaign reporting lays the groundwork for smarter and more profitable campaigns. By focusing on the right metrics, presenting data clearly, and identifying actionable insights, you can turn raw numbers into a strategic advantage. Consider this: companies driven by data are 23 times more effective at acquiring customers and 19 times more likely to sustain profitability. This underscores the importance of treating reporting as a tool for continuous improvement.
Using the insights discussed earlier, successful marketing teams make impactful changes - shifting budgets to better-performing channels, fine-tuning audience targeting based on segmentation, and resolving conversion funnel issues. Every report should conclude with clear, actionable next steps. As Stacy Wu from Matik explains: "A well-built campaign performance report doesn't just summarize metrics; it turns data into actionable strategies".
Moreover, these reports help align marketing, sales, and operations around shared goals. With 87% of sales and marketing leaders agreeing that team alignment is essential for growth, it's crucial to craft reports that are straightforward, jargon-free, and focused on outcomes. The payoff is clear: businesses that use data effectively often see annual growth rates exceeding 30%.
Take these lessons into your next campaign: Record what worked, analyze what didn’t, and apply those insights moving forward. The strength of your post-campaign reports lies in the lessons they bring to light - helping you move beyond running campaigns to creating a sustainable engine for growth.
FAQs
Which KPIs should I prioritize for my campaign goal?
When setting up your campaign, it's crucial to focus on KPIs that match your specific goals. For example:
- If your goal is brand awareness, keep an eye on metrics like organic traffic, impressions, and reach. These numbers show how visible your brand is to your target audience.
- For campaigns aimed at lead generation or sales, you'll want to track conversion rates, click-through rates (CTR), and return on investment (ROI). These metrics give you a clear picture of how effectively your campaign is driving results.
- In digital campaigns, engagement metrics such as likes, shares, and comments, along with overall website traffic, are key indicators of success.
- For SEO-focused efforts, pay close attention to keyword rankings, organic traffic, and the number of backlinks your site earns.
By aligning your KPIs with your campaign's purpose, you ensure you're measuring what truly matters for success.
How do I set up tracking (UTMs and GA4) before a campaign starts?
Before launching your campaign, it's crucial to set up tracking to understand where your traffic is coming from and how your campaign performs. This involves creating UTM parameters to tag your URLs. These tags help identify the traffic source, medium, and campaign.
Here’s how to do it:
- Use core UTM tags such as
utm_source,utm_medium, andutm_campaign. - Append these tags to your campaign URLs to track specific details. For example, your email links or ad URLs should include these parameters.
Once your tagged URLs are ready, incorporate them into your campaign materials, like email newsletters or ads. Make sure your GA4 property is set up to recognize these UTM tags. To prevent data issues, follow best practices like using consistent lowercase formatting for all parameters. This helps avoid splitting data into multiple entries due to inconsistent capitalization.
Which attribution model should I use for post-campaign reporting?
The right attribution model for post-campaign reporting depends on what you're aiming to achieve and how your customers interact with your brand. For instance, last-click attribution gives all the credit to the final interaction before conversion, making it useful if you're focused on closing sales. On the other hand, time decay or multi-touch models spread credit across several touchpoints, offering a broader view of the customer journey.
To make the most of your reporting, pick a model that fits your goals. Don’t hesitate to test different approaches to see which one delivers the most actionable insights for your business.