
Ultimate Guide to Personalization ROI Metrics
April 30, 2026Personalization can boost revenue, reduce costs, and improve customer retention - but proving its impact is often the challenge. This guide breaks down how to measure the return on investment (ROI) of your personalization efforts, focusing on metrics that directly tie to business outcomes. Key takeaways:
- ROI Formula: (Revenue lift + Cost savings) / Total investment.
- Primary Metrics: Conversion rate uplift, average order value (AOV), customer lifetime value (CLV), and churn rate reduction.
- Engagement Metrics: Click-through rates, session duration, and unsubscribe rates to gauge customer response.
- Measurement Steps:
- Define clear business goals.
- Use control groups and A/B testing.
- Consolidate data from multiple sources.
- Calculate incremental ROI from personalization efforts.
What Are Personalization ROI Metrics?
Definition and Purpose
Personalization ROI metrics are tools that connect personalized customer experiences to tangible business outcomes like revenue growth, customer retention, and operational efficiency. These metrics help assess whether strategies like tailored recommendations, dynamic content, or targeted offers are producing measurable results.
Unlike vanity metrics such as clicks or page views, these metrics focus on outcomes that matter financially. For example, instead of just noting that a user clicked on a recommendation, they track whether that click led to a purchase and generated additional revenue compared to a generic customer experience.
Their primary purpose is to create a clear, measurable link between investment in personalization and the returns it generates. This approach shifts the focus from guesswork to concrete, data-backed results, laying a solid foundation for understanding their strategic value.
Why These Metrics Matter
Personalization ROI metrics are essential for making smarter, data-driven decisions about marketing efforts. They help businesses identify which tactics are worth expanding and which need refinement. By monitoring indicators like conversion rate improvements, customer lifetime value, and reductions in support tickets, marketing teams can build a strong, financially grounded case for their strategies.
These metrics also bridge the gap between marketing efforts and executive priorities. They translate personalized marketing initiatives into financial terms that resonate with decision-makers, like CFOs. As Ketan Pande from VWO explains:
"The right metric navigates you toward your goal and prevents you from getting lost on the wrong path".
Additionally, these metrics highlight areas for improvement. For instance, if a strategy boosts engagement but doesn’t lead to more conversions, it signals the need for further testing and adjustments. By relying on real interaction data instead of assumptions, businesses can fine-tune their personalization efforts to focus on what truly delivers results. Understanding these metrics is key to identifying which strategies drive meaningful outcomes.
sbb-itb-cef5bf6
Revolutionizing Loyalty: AI, Personalization, and ROI Insights
Primary Business Metrics for Personalization ROI
Now that we've covered the basics of personalization ROI metrics and why they matter, let's dive into the key business indicators that can help measure its impact.
Conversion Rate Uplift
Conversion rate uplift tells you how much personalization is boosting your conversions. It goes beyond seasonal trends or overlapping campaigns to show whether your tailored experiences are actually driving more sales, sign-ups, or other actions. The formula is simple: subtract the conversion rate of a control group (which gets a generic experience) from the personalized group’s rate, divide by the control group rate, and multiply by 100. For example, if your control group converts at 2% and the personalized group converts at 2.4%, that’s a 20% uplift.
Even a modest 10% uplift, paired with a 10% increase in Average Order Value (AOV), can lead to a 26% revenue boost. Breaking the data down by specific customer segments - like personas or stages in the sales funnel - can also reveal how different groups respond to personalization.
Average Order Value (AOV)
Once you've improved conversion rates, the next focus is boosting how much each customer spends. AOV, or the average amount spent per transaction, is calculated by dividing total revenue by the number of orders. This metric is key for understanding how personalization impacts cross-selling and upselling.
For example, personalized product recommendations can directly increase AOV in eCommerce. SaaS companies see a similar effect, often measured as Average Revenue Per User (ARPU), by promoting premium plans or add-ons. A great example is Bear Mattress, which revamped its cross-sell process with personalized suggestions based on purchase history, leading to a 16% revenue increase. Even a 5% bump in AOV can add up significantly over time, especially with a large customer base. Always compare personalized strategies to non-personalized ones to ensure the results are directly tied to personalization efforts.
Customer Lifetime Value (CLV)
While conversion rates and AOV focus on short-term wins, CLV looks at the bigger picture: the total revenue a customer generates throughout their relationship with your business. The formula typically used is: Average Order Value × Number of Repeat Sales × Average Retention Time.
Personalization can have a major impact on CLV by encouraging repeat purchases and building loyalty. Businesses using AI-driven personalization have reported an average 45% increase in CLV. For instance, The Foschini Group saw a 35.2% jump in online conversion rates and a 39.8% increase in revenue per visit during Black Friday 2024 after implementing Bloomreach Clarity. Similarly, Yves Rocher experienced an 11× boost in purchase rates for recommended products in 2025 thanks to real-time personalized suggestions.
"If you're not measuring customer lifetime value, you're missing the personalization jackpot." – Anubhav Verma, Associate Content Marketing Manager, Optimizely
Tracking retention rates, purchase frequency, and the time between orders can further highlight how personalization drives long-term customer value.
Churn Rate Reduction
Reducing churn is another critical piece of the personalization puzzle. Churn rate measures the percentage of customers who stop doing business with you over a specific period. Personalization helps reduce churn by creating experiences that consistently align with customer expectations across all touchpoints. AI-driven personalization strategies have shown to cut churn by 40%.
This matters because retaining existing customers usually costs less than acquiring new ones. When you track churn rate alongside CLV, you get a clearer picture of customer retention. A lower churn rate directly contributes to increased lifetime value, making it a win-win.
Additional Metrics for Tracking Engagement
Primary metrics show the financial impact, but engagement metrics offer an early glimpse into how well your efforts resonate with customers. They help you identify whether your personalization strategies are effective or if they’re crossing the line into annoyance. By monitoring these, you can adjust your approach before customers start disengaging.
Unsubscribe and Complaint Rates
Unsubscribe and complaint rates are like a reality check for your personalization strategy. If these numbers are high, it’s a clear sign that your idea of "relevance" isn’t aligning with what your customers want. When people opt out of communications or report messages as spam, they’re signaling that the content feels irrelevant or intrusive.
But here’s the catch: complaint rates only scratch the surface. Studies show that only 1 in 26 dissatisfied customers actually voices their concerns to a company. The rest? They quietly leave. By tracking both unsubscribe and complaint rates, you get a fuller picture of customer satisfaction and its effect on Customer Lifetime Value (CLV). If you’re increasing the frequency of your messages but your unsubscribe rate stays stable or low, it’s a strong indicator that your personalization efforts are striking the right balance without overwhelming your audience.
Click-Through Rate (CTR) and Engagement Metrics
Click-through rate (CTR) on personalized content is a direct measure of how well your algorithm understands user preferences. If CTR remains consistently low, it’s a sign that your personalization strategy isn’t hitting the mark. Beyond CTR, metrics like session duration and pages per session can provide additional context about user engagement.
However, longer sessions without conversions can sometimes indicate confusion rather than genuine interest. The goal of personalization should be to guide users efficiently to what they need - not to trap them in a "content maze". A successful strategy often results in users completing their goals in fewer steps, which might reduce session length while boosting conversions and overall ROI. Another crucial factor to consider is the speed at which these personalized experiences are delivered, as discussed below.
Personalization Latency
Speed is critical when it comes to personalization. Visitors give your landing page about 50 milliseconds to prove its relevance before they decide to leave. This means your system must deliver tailored content almost instantly. Personalization latency measures how quickly user data is processed and translated into a customized experience.
Even the most perfectly tailored content loses its impact if there’s a noticeable delay. To keep users engaged, aim for latency under 50ms. Low latency ensures a seamless, frustration-free experience that directly improves conversion rates. In fact, 68% of customers specifically value the quick response times of chatbots in personalized service environments. When personalization feels fast and intuitive, it builds trust. But when it’s slow, it can ruin the experience entirely.
How to Measure Personalization ROI
Once you’ve identified the key metrics that matter, the next step is figuring out how to measure the true impact of personalization. Demonstrating the ROI of personalization is crucial to proving that your tailored efforts are driving both revenue and efficiency. However, many marketing teams struggle to connect personalization with financial results, leaving businesses in the dark about its actual value. The difference between success and failure often lies in following a clear, structured approach to measurement.
Step 1: Set Clear Business Goals
Before diving into any personalization initiative, you need to define your objectives. Are you looking to boost conversion rates by 15%? Cut churn by 10%? Increase the average order value by $20? Without specific goals, your data collection efforts will lack focus. Start by establishing a baseline for every metric you plan to track - this gives you a starting point to measure improvement. As a rule of thumb, you can’t gauge progress if you don’t know where you began. With these goals and baselines in place, use controlled experiments to pinpoint personalization’s impact.
Step 2: Use Control Groups and A/B Testing
After setting your goals, the next step is isolating the effect of personalization from other factors like seasonal trends or broader marketing campaigns.
"No control group = no credible measurement".
To do this, maintain a control group that receives a generic experience while others experience the personalized version. A holdout group - typically 5–15% of your traffic - acts as a reliable baseline, showing whether personalization is working or if its effects are tapering off over time. Without this comparison, it’s impossible to determine whether personalization alone is driving your results. Once you’ve isolated its impact through A/B testing, you can calculate the incremental ROI.
Step 3: Calculate Incremental ROI
The formula to measure personalization ROI is simple: (Revenue lift + Cost savings) / Total investment. Revenue lift includes gains like higher conversion rates, increased average order value, and improved customer lifetime value from the personalized group compared to the control. Cost savings come from more efficient marketing and operational improvements. Total investment should factor in all costs - technology, personnel, and ongoing maintenance. The focus should be on incremental gains beyond the control group’s performance. For instance, even a modest 10% increase in conversion rates and average order value can lead to as much as a 26% boost in overall revenue and return on ad spend (ROAS).
Step 4: Combine Data Sources
Fragmented data is one of the biggest challenges marketers face - 44% of top marketing executives cite it as a major obstacle when measuring ROI. To address this, aim to consolidate data from various sources like analytics tools, CRM systems, email platforms, and other marketing channels. Using a Customer Data Platform (CDP) or a warehouse-native analytics solution can help you create a unified view of your data. This allows you to track the entire customer journey and apply multi-touch attribution models, ensuring personalization’s impact is recognized at every stage - not just at the final interaction. Without this comprehensive approach, you’ll only see a partial picture of personalization’s true value.
ROI Calculation Examples
Personalization ROI Metrics Impact Table: Control vs Personalized Performance
This section builds on the earlier measurement steps, offering practical examples to show how key metrics translate into ROI.
Sample ROI Table for Key Metrics
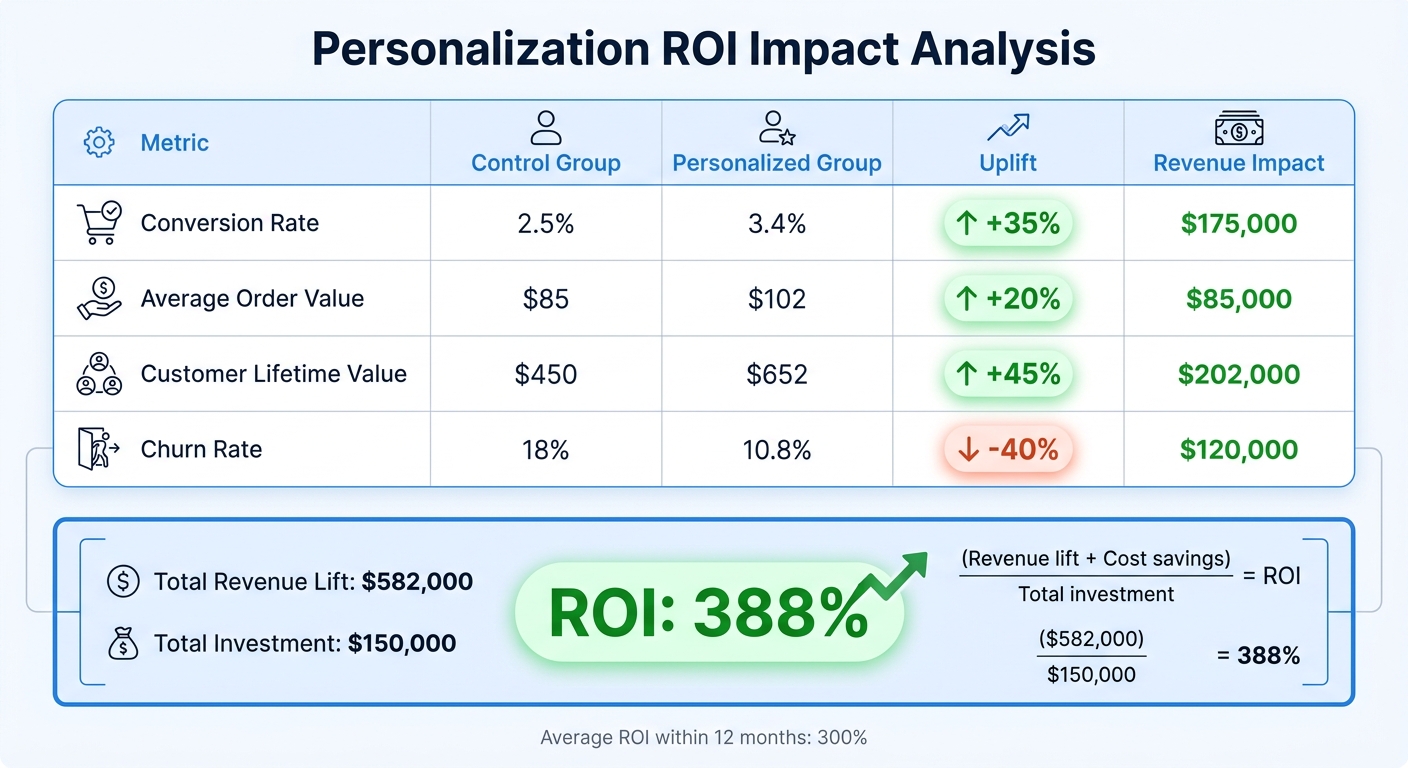
Here’s a breakdown of how personalization impacts revenue, comparing a control group to a personalized group:
| Metric | Control Group | Personalized Group | Uplift | Revenue Impact |
|---|---|---|---|---|
| Conversion Rate | 2.5% | 3.4% | +35% | $175,000 |
| Average Order Value | $85 | $102 | +20% | $85,000 |
| Customer Lifetime Value | $450 | $652 | +45% | $202,000 |
| Churn Rate | 18% | 10.8% | -40% | $120,000 |
This table highlights the formula for ROI: (Revenue lift + Cost savings) / Total investment. For instance, if your total investment is $150,000 (covering platform licensing, implementation, and personnel), the ROI would be calculated as:
($582,000) / $150,000 = 388%
This aligns with the 300% average ROI companies often achieve within 12 months of implementing AI-driven personalization. In industries like financial services, advanced strategies can even deliver ROIs as high as 800%.
Short-Term vs. Long-Term Metrics
Personalization delivers benefits on both short and long timelines. Short-term metrics, such as conversion rate and average order value, often show results in a matter of days or weeks. On the other hand, long-term metrics like Customer Lifetime Value (CLV) and churn rate reflect the cumulative advantages over months or years. For example, a 45% increase in CLV means each customer relationship generates more profit over time, even if the full impact isn’t immediately visible. Reporting on both timeframes helps you showcase quick wins while justifying continued investment for sustained growth.
Cost Efficiency Analysis
Personalization doesn’t just boost revenue - it also cuts costs. In financial services, personalized cross-sell strategies can lead to 60–80% conversion lifts while lowering Customer Acquisition Costs (CAC). Better targeting reduces wasted spend on unlikely-to-convert prospects, and AI-powered workflows save time by automating manual tasks. For B2B SaaS companies, these efficiencies are even more quantifiable. Consider this: resolving a single support ticket costs $15–$25 on average. Faster resolutions through AI-driven personalization can result in significant savings.
A VP of Digital Commerce from a global retailer shared:
"The ROI was immediate and substantial. We recovered our investment in just 3 months".
This example emphasizes how tracking both revenue gains and cost savings demonstrates that personalization can often pay for itself quickly. By combining these insights with earlier measurement steps, you can create a clear framework for assessing the financial impact of personalization strategies.
Conclusion
Tracking the return on investment (ROI) of personalization isn't just about crunching numbers; it's about tying the right metrics to meaningful business results. The key to success lies in focusing on what truly drives impact: metrics like conversion rate uplift, average order value (AOV), customer lifetime value (CLV), and churn reduction.
The process is simple in concept but demands consistency. Begin by establishing clear pre-personalization baselines. Keep control groups of 5–15% to identify the actual impact of your efforts, and organize your key performance indicators (KPIs) into three layers: Experience (measuring quality and relevance), Engagement (tracking behavioral changes), and Economics (evaluating business outcomes). This structured approach transforms fragmented data into a compelling narrative that resonates with decision-makers.
Despite its importance, many marketing teams still grapple with measuring personalization's true value. This often stems from a reliance on vanity metrics - like time spent on site - that don't directly connect to business results. The solution? Focus on causal indicators that prove personalization drives outcomes and prioritize metrics that highlight long-term value, such as CLV. With so many customers expecting tailored experiences, it's crucial to align personalization strategies with measurable, impactful goals.
As Ameya Deshmukh from Everworker insightfully stated:
"Personalization wins, but measurement makes it real".
Without precise tracking, meaningful analysis becomes impossible. However, with a solid measurement framework in place, demonstrating personalization's ability to drive sustained growth becomes much easier. For instance, one global retailer managed to recover their investment in just three months by following this disciplined approach. Regular tracking - through weekly reports and monthly reviews - ensures your strategies stay on course and continue evolving with customer needs.
FAQs
What costs should I include in personalization ROI?
When figuring out the ROI of personalization, it's crucial to consider every cost involved in both implementation and ongoing efforts. Some of the most common expenses include technology costs (like AI tools and platform subscriptions), data collection and analysis, content creation, and continuous optimization.
You’ll also want to factor in personnel costs - this means salaries for marketers, analysts, and tech teams. Don’t overlook expenses for staff training, infrastructure maintenance, and ensuring compliance with privacy regulations. Taking all these into account provides a full picture of ROI and helps you better understand the value personalization brings to your efforts.
How long does it take to see personalization ROI?
The timeline for seeing a return on investment (ROI) from personalization efforts can differ depending on the metrics you prioritize and how the strategy is implemented. It's better to focus on metrics that drive impact, such as reducing time-to-value, deflecting support tickets, or increasing revenue per user, rather than getting caught up in vanity metrics. While the exact results will depend on your specific business circumstances, monitoring key performance indicators over several weeks or months usually reveals clear insights into how effective your personalization efforts are.
How do I measure personalization ROI across channels?
To assess the return on investment (ROI) of personalization across different channels, it's essential to focus on tangible outcomes like revenue growth, user engagement, and enhancements in customer experience. Effective measurement methods include:
- Incrementality tests: These help isolate the impact of personalization efforts by comparing results with and without those interventions.
- A three-layer KPI stack: This framework evaluates performance across three critical areas - experience, engagement, and economics.
- End-to-end tracking: Comprehensive tracking ensures you capture the full journey and results across channels.
Make it a habit to report weekly deltas, showing measurable improvements from AI-driven workflows across platforms like websites, email campaigns, paid advertising, and sales efforts. Focus on metrics that demonstrate real business impact rather than vanity metrics, ensuring your evaluation aligns with meaningful goals.