21 Social Media Engagement Metrics To Track
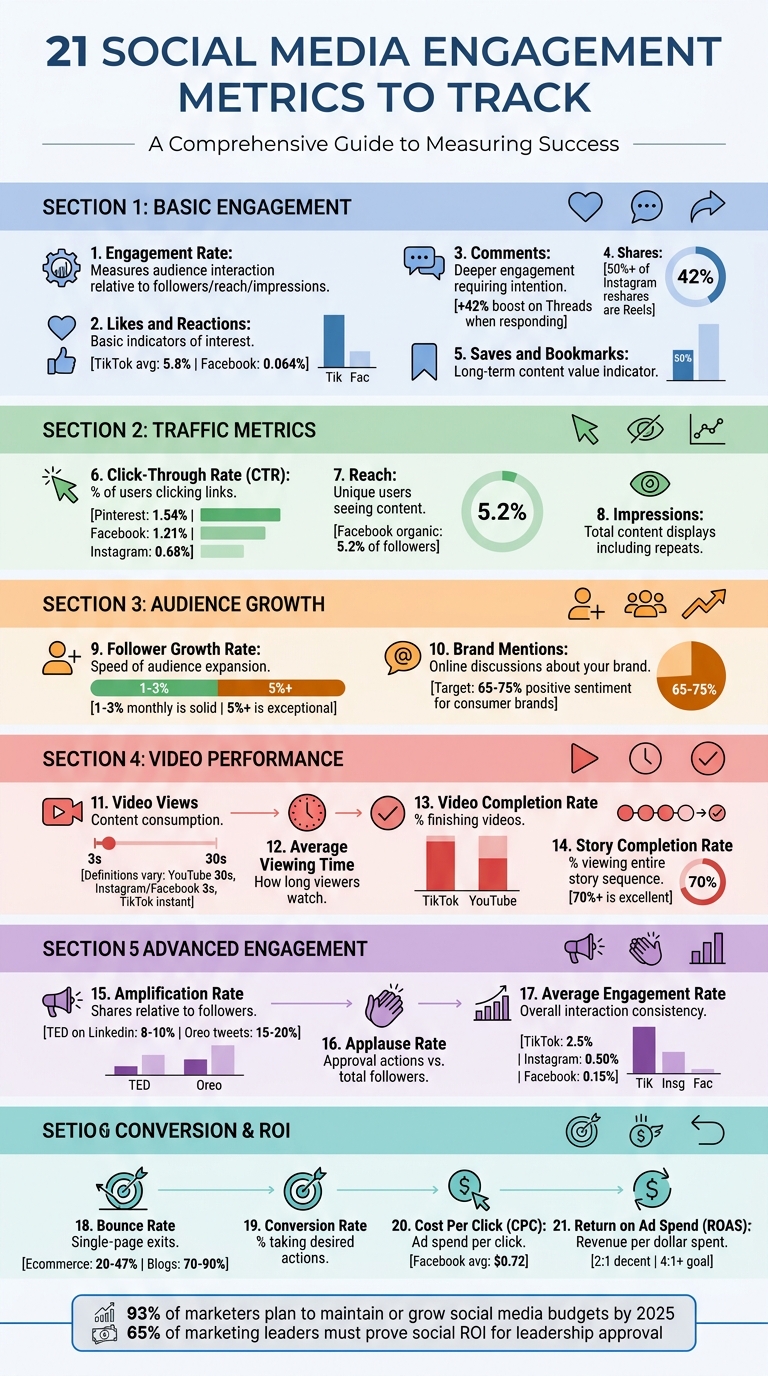
May 5, 2026Social media engagement metrics help you measure how well your content performs and connects with your audience. Tracking the right metrics ensures you can refine your strategy, justify budgets, and improve ROI. Here’s a quick breakdown of the 21 key metrics:
- Engagement Rate: Measures audience interaction (likes, comments, shares) relative to followers, reach, or impressions.
- Likes and Reactions: Basic indicators of audience interest and sentiment.
- Comments: Reflect deeper engagement and open opportunities for interaction.
- Shares: Show how often users distribute your content to their networks.
- Saves and Bookmarks: Indicate long-term content value.
- Click-Through Rate (CTR): Tracks how often users click links in your posts.
- Reach: Measures the unique number of users who see your content.
- Impressions: Counts how often your content is displayed, including repeat views.
- Follower Growth Rate: Tracks how quickly your audience is expanding.
- Brand Mentions: Monitors how often your brand is discussed online.
- Video Views: Tracks how many users watch your video content.
- Average Viewing Time: Measures how long viewers stay engaged with your videos.
- Video Completion Rate: Shows the percentage of viewers who finish watching your videos.
- Story Completion Rate: Tracks how many users view your entire story sequence.
- Amplification Rate: Measures shares relative to your follower count.
- Applause Rate: Reflects the ratio of likes and reactions to followers.
- Average Engagement Rate: Provides an overview of overall audience interaction over time.
- Bounce Rate: Tracks how often users leave your site without interacting further.
- Conversion Rate: Measures the percentage of users who take a desired action (e.g., purchase, sign-up).
- Cost Per Click (CPC): Tracks the cost for each click on your ads.
- Return on Ad Spend (ROAS): Measures revenue generated for every dollar spent on ads.
These metrics provide actionable insights into audience behavior, content performance, and campaign effectiveness. By focusing on the right data, you can align your social media efforts with business goals and drive measurable results.
21 Essential Social Media Engagement Metrics to Track in 2026
How to Measure Social Media Performance Like a Pro
sbb-itb-cef5bf6
1. Engagement Rate
Engagement rate measures how your audience interacts with your content compared to how many people see it. It includes actions like likes, comments, shares, and saves, calculated against either your audience size or the number of times the content is displayed.
Here are the three main ways to calculate engagement rate:
- By followers: (Total Engagements / Total Followers) x 100. This shows how active your existing followers are.
- By reach: (Total Engagements / Total Reach) x 100. This indicates how well you’re converting unique viewers into participants.
- By impressions: (Total Engagements / Total Impressions) x 100. This takes into account repeat views.
Engagement rate helps determine if your content resonates with your audience. For instance, a post with 100,000 impressions but only 50 engagements suggests it isn’t striking a chord. On the other hand, a smaller account with 1,000 followers and 50 engagements boasts a 5% engagement rate, signaling stronger audience interaction compared to a large account with just 0.05%.
"Reach is the platform doing you a favor. Engagement is your audience choosing you." – Buffer
A high engagement rate not only reflects audience interest but also signals to platform algorithms that your content is worth promoting, which can boost its organic reach. On Instagram, engagement rates typically range between 1% and 5%, while LinkedIn sees an average of around 6.2%. However, major brands like Nike often see lower rates - between 0.25% and 0.35% - due to their massive followings.
To improve your strategy, track engagement rates across content types like videos, images, or carousels. This can reveal what your audience enjoys most and help you benchmark your performance against industry norms. From there, you can dive into likes and reactions to better understand specific audience behaviors.
2. Likes and Reactions
Likes and reactions are the first signs that your content has caught someone's attention. They only require a quick tap, but that small action shows your post resonated enough to spark engagement.
Different platforms offer various reaction options, giving insight into audience sentiment. For example, Facebook and LinkedIn provide multiple reactions, like "Love" or "Funny", which can reveal how people feel about your content. If a LinkedIn post gets a lot of "Funny" reactions, it might mean your audience enjoys a humorous approach.
"Reactions are basic engagements (like, love, laugh, etc.) that represent what users think about your content." – Semrush
These interactions often influence platform algorithms. High engagement early on can lead to your post being shown to more people organically. However, engagement benchmarks differ by platform: TikTok brands typically see an average engagement rate of 5.8%, while Facebook’s median engagement rate is just 0.064%. This means getting a like on Facebook might feel like a bigger win compared to TikTok.
Paying attention to the ratio of impressions to likes can help you measure how well your content connects with viewers. For instance, if a post reaches 50,000 people but only gets 25 likes, it suggests your content didn’t make a strong impression. Monitoring specific reactions is also useful. A sudden increase in "angry" reactions, for example, could signal a potential issue with how your brand is being perceived.
These initial reactions often pave the way for deeper engagement, like comments, which we’ll dive into next.
3. Comments
Comments signal a deeper level of engagement since they require more time and thought than a simple like or reaction. Unlike quick gestures, a comment reflects a deliberate effort to connect with your content.
"A comment takes intention." – Buffer
The value of comments lies not just in their presence but in their quality. Positive comments highlight what resonates with your audience, while critical ones can point out areas for improvement. Regularly reviewing comments can reveal recurring customer issues, product ideas, or even early signs of potential reputation problems. Essentially, comments serve as a form of free market research. And when you respond to them, you’re not just answering questions - you’re building relationships.
Engaging with comments also amplifies your content's reach. For instance, replying to comments can increase engagement by +42% on Threads, +30% on LinkedIn, +21% on Instagram, +9% on Facebook, and +8% on X. Additionally, 40% of consumers expect a response within an hour, so timely replies show you’re paying attention and value their input.
Social media platforms reward this kind of interaction. Algorithms on platforms like Facebook and X favor posts that drive conversations, meaning more comments can lead to greater visibility. To spark meaningful discussions, try asking specific, engaging questions in your posts. For example, instead of a vague "What do you think?", you could ask, "What’s one piece of career advice you’d unlearn?" These types of questions often elicit richer responses. Another tip: dedicate 15–20 minutes after publishing a post to engage with early comments. This signals to the algorithm that your post is generating activity, which can boost its reach even further.
4. Shares
Shares - sometimes referred to as reposts or retweets, depending on the platform - show how often users distribute your content to their own networks. Unlike a simple like, which takes just a quick tap, sharing requires a conscious decision to endorse your content. That makes shares one of the clearest indicators of your content's impact.
"Shares offer a different kind of insight. They show which content pieces your audience finds worthy of sending. If people pass your content along to friends, that's a strong vote of brand confidence and a big boost to brand awareness." – Sprout Social
Shares are a key driver for increasing your organic reach. When someone shares your post, it gets in front of entirely new audiences - people who might not have encountered your brand otherwise. This kind of free exposure is incredibly valuable for growing your visibility. For example, more than 50% of all content reshared through Instagram DMs is now in the form of Reels, showing just how important private sharing has become as a distribution method.
Social media algorithms also prioritize shares, especially when they happen through Direct Messages. Instagram, for instance, views DM shares as a strong signal that your content deserves wider distribution. The more your content is shared - particularly in ways that reflect positive engagement - the more credibility your brand gains. This can help establish your business as a reliable voice in your industry.
To better understand what drives shares, pay attention to the types of content your audience finds most engaging. Posts that evoke emotion, teach something new, or inspire action are usually the ones people are most likely to share. As we’ll discuss in upcoming sections, shares are a critical part of assessing how well your content spreads across networks and amplifies your message.
5. Saves and Bookmarks
Saves and bookmarks go beyond the immediate reactions like likes or shares, providing a deeper look into how much users value your content over time. When someone saves a post, it’s a clear signal that they find it useful or meaningful enough to revisit later. This action highlights the enduring relevance of your content.
"Saves indicate content value - people bookmark posts they want to reference later, which tells you your content provides lasting utility." – YouScan
Unlike likes or comments, saves reflect a more deliberate form of engagement. Tutorials, how-to guides, recipes, and checklists often see high save rates because they offer practical, long-lasting benefits. This makes saves an excellent measure of whether your content delivers genuine value rather than just fleeting entertainment.
Saves also play a key role in how social media platforms rank content. On Instagram, for example, saves are seen as a strong indicator of high-quality content. The algorithm views saves as proof that a post deserves broader visibility, potentially increasing your organic reach. Pairing save data with metrics like video views and completion rates can give you a clearer understanding of how well your content holds audience attention.
To leverage this metric effectively, review which posts are being saved the most. Identify common themes, formats, or styles that resonate with your audience. Posts that consistently earn saves confirm their lasting relevance and utility.
6. Click-Through Rate (CTR)
Click-Through Rate (CTR) tracks the percentage of users who click on a link in your social media post after viewing it. The formula is simple: (Total Clicks / Total Impressions) x 100. Essentially, CTR measures how well your content inspires users to take action, like visiting your website or landing page.
What sets CTR apart from metrics like impressions or likes is that it reflects active engagement. A click means the user is genuinely interested in what you're offering. As Morgan Campbell, Associate Director of Marketing at Purdue University, puts it:
"Link clicks that take the user away from the social media platform are another important piece of engagement: they let you know the viewer is willing to leave the platform to engage with you".
CTR benchmarks vary by platform. In 2026, Pinterest leads with an average organic CTR of 1.54%, followed by Facebook at 1.21%, Twitter/X at 0.86%, TikTok at 0.84%, Instagram at 0.68%, and LinkedIn at 0.67%. For paid ads, a CTR between 1% and 3% is generally considered solid. These benchmarks provide a baseline to evaluate your performance and spot underperforming content.
If your CTR isn't where you want it to be, there are ways to improve. Use UTM tracking codes to pinpoint which posts and campaigns drive the most traffic. Experiment with different headlines, images, or call-to-action (CTA) buttons to see what resonates. Action-oriented CTAs like "download", "register", or "learn more" work well because they clearly guide users on what to do next.
Keep an eye on CTR alongside conversion rates to ensure you're attracting the right audience. For example, a high CTR but low conversion rate might mean your landing page doesn't align with what your social post promised. Testing and refining these elements can help you strike the right balance.
Next, explore how reach works hand-in-hand with CTR to sharpen your engagement strategy.
7. Reach
Reach measures the number of unique users who see your content, as opposed to counting repeated views. For example, if someone scrolls past your Instagram Reel three times in one day, that counts as three impressions but only one reach.
This metric is crucial for understanding your audience size - it’s a clear indicator of how far your content is spreading and how well your brand is building awareness. Let’s say a post racks up 10,000 impressions. That might sound incredible at first glance, but if those views come from just 2,000 unique individuals, your actual reach - and influence - is only 2,000.
Different platforms define and calculate reach in their own way. Facebook, for instance, breaks it down into Organic, Paid, and Viral categories. Instagram refers to it as "Accounts Reached" across posts, Stories, and Reels. TikTok calculates reach by counting the total unique accounts that have viewed a video. On the other hand, platforms like X (formerly Twitter) and LinkedIn often don’t offer a built-in reach metric.
It’s worth noting that organic reach can be surprisingly low. On Facebook, for example, an average organic post reaches just 5.2% of a page’s followers. This makes it essential to monitor reach alongside engagement. If your reach is high but engagement is low, it could mean your content isn’t resonating with the audience or is targeting the wrong group.
To increase your reach, consider these strategies:
- Post when your audience is most active.
- Use relevant hashtags to help algorithms categorize and surface your content.
- Create shareable posts that encourage users to spread your message.
When combined with impressions, reach gives you a more complete picture of your content’s performance. Together, they help you understand not just how many people see your content, but how often they interact with it.
8. Impressions
Once you've measured reach, the next step is to look at impressions, which track how many times your content is displayed on a screen. Unlike reach, which counts unique viewers, impressions count every instance of your content appearing - whether it’s seen multiple times by the same person or not .
Here’s an example: if 90 followers each see your post three times, your reach remains 90, but your impressions jump to 270. This distinction is important because repeated exposure often helps people remember content. Impressions let you measure that repetition and understand how frequently your audience encounters your brand.
"Impressions give you an idea of how often your content is being seen, revealing content frequency." – Worcester State University
Different platforms define impressions in their own way. For instance:
- YouTube: An impression is counted when at least 50% of a video thumbnail is visible for one second.
- X (formerly Twitter): Impressions are logged every time a post appears in a user’s feed or search results.
- TikTok: Impressions are tracked similarly to video views.
- Instagram: As of 2026, Instagram now uses "Views" as its main metric, replacing the "Impressions" label but still counting repeat views.
Analyzing the impressions-to-reach ratio can provide valuable insights. If your impressions significantly outpace your reach, it means your content resonates - users are revisiting it. On the other hand, if impressions are high but reach is low, it might indicate you're overexposing a small audience. In such cases, reducing your posting frequency could help prevent audience fatigue.
Impressions also play a role in calculating key metrics like Click-Through Rate (CTR) and Engagement Rate by Impressions:
- CTR: (Total Clicks / Total Impressions) × 100
- Engagement Rate by Impressions: (Total Engagements / Total Impressions) × 100
These calculations help you understand how often your audience not only sees your content but also interacts with it, tying impressions back to broader engagement metrics.
9. Follower Growth Rate
Follower growth rate goes beyond just tracking reach and impressions - it measures how quickly your audience is expanding. Essentially, it shows how well your content resonates with people, convincing them to hit that "follow" button and become part of your community.
To calculate it, divide the number of new followers gained during a specific period by your starting follower count, then multiply by 100. For instance, if you began a quarter with 15,000 followers and ended with 18,000, your growth rate would be 20%. Unlike raw follower counts, this metric highlights your account's momentum in attracting new audiences, giving you a clearer sense of your growth trajectory.
For accounts that are already established, a monthly growth rate between 1% and 3% is considered solid. If your growth rate exceeds 5%, it’s a sign that your strategy is delivering exceptional results. This also gives you insight into how your content quality and brand appeal stack up against competitors.
"Follower count is often dismissed as a vanity metric. But when evaluated over time as follower growth, it offers a complete picture of your channel's health, the awareness you're building and whether you're outpacing competitors - or falling behind." – Sprout Social
Tracking this metric on a month-to-month basis allows you to pinpoint what’s working. For example, a noticeable spike might be tied to a successful campaign, a trending video, or even a shift in your posting schedule. On the flip side, if growth slows or plateaus, it’s a signal to tweak your approach.
Up next, we’ll explore how brand mentions can amplify your digital presence.
10. Brand Mentions
Brand mentions happen when people talk about your brand, products, or campaigns online. This could be through social media posts, comments, news articles, blogs, forums, or podcasts. These mentions might include direct @tags, text references (even with spelling errors), branded hashtags, or even visual and verbal shoutouts.
Keeping track of brand mentions offers two key benefits: it helps measure brand awareness by identifying organic discussions (even untagged ones) and shows audience sentiment by categorizing mentions as positive, neutral, or negative. For instance, consumer brands generally aim for 65–75% positive sentiment, while B2B SaaS companies typically see a range of 55–65% positive sentiment.
"Social media mentions are essentially digital word of mouth, spreading through the vast networks of social media aggregators and personal feeds." – Mailchimp
Here’s why this matters: Around 55% of consumers check social media for business feedback before making a purchase, and nearly 75% expect brands to respond within 24 hours. Plus, social platforms often give more visibility to content that sparks quality engagement - like comments, shares, and replies - helping your messages reach more people.
Don’t just monitor tagged mentions. Use social listening tools to spot misspellings, abbreviations, and untagged conversations where your brand is being discussed. These overlooked mentions often provide the most genuine feedback and open doors for unexpected customer engagement.
Next, we’ll dive into how video views can expand your content’s reach.
11. Video Views
Video views are a key indicator of how much your content is being consumed, but here's the catch: each platform defines a "view" differently. For instance, YouTube only counts a view after 30 seconds of intentional watch time, while Facebook and Instagram log a view after just 3 seconds of play. TikTok, on the other hand, considers a view as soon as playback begins. Twitter (X) strikes a middle ground, requiring at least 2 seconds of watch time with 50% of the video visible on the screen.
These differences highlight why a "view" on TikTok doesn't carry the same weight as a "view" on YouTube. Comparing raw view counts across platforms is like comparing apples to oranges. Instead, it's smarter to set benchmarks that align with each platform's unique metrics.
"On every network, the metric that relates to the goal or purpose of the video is what you should measure. If your goal is awareness, if it's an ad, if you want your video in front of thousands of people - views are more important." – Rachael Samuels, Senior Social Media Manager, Sprout Social
But let’s be clear: views alone won’t tell the whole story. If you’re seeing high view counts but low likes or poor completion rates, it’s a sign your opening hook is working, but the rest of the content might be falling flat. Those first 3 to 30 seconds are crucial - they determine whether viewers stick around or move on. Considering that 84% of viewers are influenced to make a purchase after watching a brand video, turning views into meaningful engagement can directly impact your revenue.
Also, don’t overlook the difference between unique views and total views on platforms like Facebook and LinkedIn. Unique views count each individual only once, no matter how many times they watch, while total views include all replays. This distinction can help you understand whether your video is reaching a wide audience or being rewatched by a smaller group of viewers.
Next, we’ll dive into how average viewing time reveals whether your audience stays engaged throughout your videos.
12. Average Viewing Time
Average viewing time (or average view duration) shows how long viewers stick around to watch your videos. You can calculate it by dividing the total watch time by the number of video plays, including replays. This metric cuts through vanity stats to reveal real engagement.
Why does this matter? It pinpoints exactly when viewers lose interest. If your average viewing time falls well short of your video’s total length, something’s off - maybe your opening isn’t engaging enough, or the pacing drags. Platforms like YouTube and TikTok take this data seriously, using watch time as a key factor in their recommendation algorithms. The longer your audience stays, the more likely these platforms are to promote your content. This metric ties into other analytics, helping you spot trends in engagement and viewer behavior.
However, platforms define a "view" differently, which impacts how you interpret this metric. For instance, YouTube logs a view after 30 seconds, while Facebook and Instagram count it after just 3 seconds, and TikTok almost instantly. A 45-second average on YouTube holds much more weight than the same on Instagram. Understanding these nuances helps you gauge true engagement and adjust your content strategy accordingly.
"If you want people to comment or take action, views aren't the most important but view duration might be." – Rachael Samuels, Senior Social Media Manager, Sprout Social
Average viewing time goes beyond surface-level metrics to reveal deeper insights into how your content performs. Look for drop-off points. If viewers leave in the first few seconds, your hook needs work. If they’re tuning out halfway through, your video might be too long or losing steam. Comparing this metric across your videos can help you pinpoint the ideal length for each platform. According to the 2025 Sprout Social Index, audiences stick with content that feels authentic, relatable, and entertaining. If your average viewing time is low, it’s time to rethink your approach. Paired with other metrics, this insight can sharpen your overall video strategy.
13. Video Completion Rate
Video engagement goes beyond just counting views - completion rate offers a deeper look at how effective your content truly is. This metric measures the percentage of viewers who watch your video from beginning to end. To calculate it, divide the number of viewers who finished the video by the total number who started it, then multiply by 100. While views tell you how many people hit play, the completion rate reveals how many stayed engaged all the way through.
Completion rate is a direct reflection of content quality. For instance, if a video racks up 10,000 views but most viewers drop off within the first five seconds, it’s a sign that while the opening caught attention, it didn’t hold it. On the other hand, a high completion rate indicates your storytelling, pacing, and visuals are keeping viewers interested. This is especially important on platforms like TikTok, where the algorithm prioritizes videos with strong completion rates for organic promotion.
Different platforms have varying benchmarks for completion rates. TikTok videos often achieve around 90% completion rates due to their short, fast-paced nature. In contrast, longer YouTube videos typically see rates between 50% and 60%. On Facebook, a "full video view" might mean watching for at least 30 seconds or finishing shorter clips entirely. As a general goal, aim for a completion rate of at least 50% for videos under 30 seconds and 30% or higher for videos over three minutes.
The first few seconds of your video are critical. If less than 70% of viewers stick around after the opening, it’s worth reevaluating your hook to make it more engaging. Use platform analytics to pinpoint where viewers are dropping off. For example, early exits could mean your introduction isn’t strong enough, while mid-video drop-offs might indicate pacing problems or less relevant content.
One last thing to consider: a high completion rate doesn’t always mean your video is resonating. If viewers are watching all the way through but not engaging (e.g., liking, commenting, or sharing), it could indicate passive consumption. Pair completion rate data with other engagement metrics to get a fuller picture of how your content is performing.
14. Story Completion Rate
Story completion rate tracks how many viewers watch your entire story sequence from start to finish. To calculate it, divide the number of viewers who reached the last frame by those who viewed the first frame, then multiply by 100. This metric is especially useful for platforms like Instagram and Facebook, where stories disappear after 24 hours. It doesn’t just measure viewership - it helps you understand how well your narrative holds attention.
Stories differ from regular feed posts because they’re designed as a mini-journey. The goal is to keep viewers engaged from the first frame to the last. Lexie Carbone, Content Marketing Specialist at Later, puts it this way:
"A Story sequence behaves more like a mini journey than a standalone post. You are not just measuring whether one frame was seen. You are measuring whether the sequence kept momentum and whether the ending earned a response".
A high completion rate signals strong engagement. Generally, a rate of 70% or higher is excellent, while anything under 50% suggests your content might be too long or not engaging enough. Completion rate, along with replies, highlights active engagement, which is more meaningful than passive views. Considering that 50% of Instagram users visit a brand's website after viewing Stories, this metric directly connects to potential conversions.
To improve your completion rate, focus on creating a strong opening frame that hooks viewers. Use analytics to identify where drop-offs occur. For example:
- High forward taps might mean your pacing is too slow or your slides have too much text.
- High exit rates on specific frames could indicate creative fatigue or irrelevant content.
Simplify your sequence by removing unnecessary slides and speeding up the pace. Add interactive elements like polls or quizzes to encourage active participation. Since many users watch stories without sound, include captions to make your content accessible.
Timing also matters. Use audience insights to post when your followers are most active, ensuring your story appears at the front of their story bar. Instagram provides story analytics for 14 days in-app or 28 days via Meta Business Suite, so review your data regularly to spot trends and refine your approach for future stories.
15. Amplification Rate
Amplification rate tells you how often your followers share your content. It’s calculated using this formula: (total shares ÷ followers) × 100. For example, if your account has 10,000 followers and your posts get 200 shares, your amplification rate is 2%.
A share is more than just an interaction - it's a clear sign of brand advocacy. As Jay Baer, a Content Marketing Strategist, puts it:
"The importance of 'shareable' vs. 'likeable' content".
Some brands excel at creating shareable content. TED’s educational posts often see amplification rates of 8% to 10% on LinkedIn. Oreo’s culturally relevant tweets can hit rates between 15% and 20%. Meanwhile, The Economist’s data visualizations are shared three to four times more than their standard posts. These examples highlight how shareable content can extend your reach significantly.
If you want to boost your amplification rate, focus on crafting content that provides value - think tutorials, behind-the-scenes insights, or relatable stories. Add direct calls-to-action like “Share this with a friend,” and post during peak activity times to maximize initial visibility.
Unlike engagement rate, amplification rate zeroes in solely on shares, making it a more precise indicator of how far your content spreads. Every share creates additional impressions without requiring extra ad spend.
16. Applause Rate
Applause rate goes beyond basic engagement metrics by focusing on how much your audience actively approves of your content. It measures the ratio of approval actions - likes, reactions, and favorites - a post receives compared to your total followers. The formula is straightforward: (total approval actions ÷ total followers) × 100.
For instance, if you have 5,000 followers and your post garners 150 likes, your applause rate would be 3%. This metric highlights moments when someone pauses their scrolling to actively engage with your content, signaling intentional interaction instead of passive consumption.
Different platforms define approval actions in their own way. For example, Facebook, Instagram, LinkedIn, and X (formerly Twitter) each have unique reaction types. By tracking applause rate, you can identify which content formats strike a chord with your audience. For example, posts with images on Facebook tend to receive over twice the engagement of text-only posts. On LinkedIn, engagement rates hover around 6.2%, while X averages closer to 2.5%.
Keep an eye out for red flags. If your applause rate is low but comments are high, it could signal dissatisfaction - people might be using comments to air complaints rather than show support. Similarly, consistently low approval actions suggest your content may not be resonating with your audience, or you might be attracting the wrong crowd.
Use this metric to zero in on the topics and formats that generate the most positive reactions. Since 80% of users follow brands they perceive as authentic, a strong applause rate is a good indicator that you're cultivating meaningful connections with your audience. By understanding your applause rate, you can fine-tune your content strategy and prepare for the next layer of performance analysis.
17. Average Engagement Rate
Metrics like individual post performance can highlight specific wins, but the average engagement rate offers a broader perspective on how well your content resonates with your audience over time. This metric measures the typical level of interaction - likes, comments, shares, and other actions - your social media posts receive. It's usually calculated in relation to your follower count, reach, or impressions. Think of it as a health check for your overall content strategy, showing how consistently your audience engages with your posts.
Here’s the formula:
[(total engagements ÷ total posts) ÷ total followers] × 100.
For example, if you post 30 times, get 6,000 total engagements, and have 10,000 followers, your average engagement rate is 2%.
Each platform defines "engagement" a bit differently. On Facebook, it includes reactions, comments, and shares. Instagram focuses on likes and comments, while TikTok places more emphasis on shares and saves. These differences are reflected in platform benchmarks: TikTok leads with an organic engagement rate of about 2.5%, Instagram averages around 0.50%, and Facebook trails at roughly 0.15%.
To get meaningful insights, start by establishing a 90-day baseline using your historical data. Break this down further by content type - like Reels versus static posts - to identify which formats consistently drive engagement. If you notice a sudden dip, it could be due to platform algorithm changes, signaling that it’s time to tweak your approach.
This metric is also a great tool for setting realistic, data-driven goals. For instance, if your industry average engagement rate is 3% and you're currently at 2.5%, that gap gives you a tangible target to work toward. With 93% of marketers planning to maintain or grow their social media budgets by 2025, keeping tabs on your average engagement rate will be critical for staying ahead. By monitoring this alongside other engagement metrics, you can fine-tune your strategy to keep improving.
18. Bounce Rate
Bounce rate measures the percentage of visitors from social media who leave your website after viewing just one page without interacting. It helps determine whether the landing page delivers on the expectations set by your social media post. A high bounce rate often points to a disconnect between the social media message and the content on your site.
Analytics tools like Google Analytics 4 (GA4) have updated how bounce rate is calculated. In GA4, bounce rate is now defined as the inverse of the engagement rate - essentially, the percentage of sessions that didn’t meet the criteria for engagement. A session is considered “engaged” if it lasts more than 10 seconds, triggers a key event (like a conversion), or includes multiple page views. This means a single-page visit can avoid being classified as a bounce if the visitor spends enough time or interacts meaningfully with the page.
Bounce rates can differ significantly depending on the type of website. For example, ecommerce sites generally see bounce rates between 20% and 47%, while blog posts often have much higher rates, ranging from 70% to 90%. Across most websites, the average bounce rate falls between 26% and 70%.
To lower your bounce rate from social media traffic, make sure the content on your landing page matches the message in your social media post. Also, prioritize fast loading times and a mobile-friendly design with responsive layouts and easy-to-use buttons. Including features like internal links or "related posts" sections can encourage visitors to explore further.
Next, let’s dive into how conversion rate builds upon these engagement metrics.
19. Conversion Rate
The conversion rate shows the percentage of users who take a desired action after interacting with a social media post or ad. This could include making a purchase, signing up for a newsletter, downloading an app, or registering for an event. The formula is simple: (Total Conversions / Total Clicks) x 100.
While metrics like likes and shares highlight engagement, the conversion rate directly reflects how effectively your social media efforts lead to tangible business outcomes. It’s a key indicator of success and plays a huge role in proving ROI, which is essential for gaining leadership buy-in.
"Tying social efforts to real outcomes makes it easier to illustrate the value of social and your return on investment - crucial for securing support for your social strategy." – Sprout Social
To track conversions effectively, make use of attribution tools. Add UTM codes to every link you share so platforms like Google Analytics can identify which posts drove conversions. You should also use tracking pixels, like the Facebook Pixel, or set up key events in Google Analytics 4 to monitor user actions beyond the social platform. Without these tools, it’s nearly impossible to pinpoint which campaigns are delivering results. This level of tracking not only measures campaign success but can also highlight where users drop off in the conversion process.
If high traffic isn’t translating into conversions, the problem might lie in your landing page. Make sure the page aligns with the message of your social post. Experiment with different visuals, messaging, and CTAs to improve performance. Small tweaks can make a big difference in turning clicks into actions.
20. Cost Per Click (CPC)
Cost Per Click (CPC) tracks how much you’re spending for each click on your social media ad. To calculate it, divide your total ad spend by the number of clicks. For example, if you spend $100 and get 200 clicks, your CPC is $0.50. Keeping an eye on this metric helps you spot underperforming ads quickly. Plus, most platforms allow you to set a cap on the maximum CPC.
CPC is a critical engagement metric that ensures your ad dollars are being spent wisely.
For some context, Facebook ads average about $0.72 per click, which is generally less expensive than ads on LinkedIn, Instagram, or YouTube. Google, on the other hand, suggests starting with a maximum CPC of $1.00 for its ad platforms. These benchmarks can help you gauge how your campaigns stack up against industry standards.
Lowering CPC often comes down to making your ads more relevant and engaging. When your click-through rate (CTR) is high, platforms tend to reward you with lower costs because your ad is seen as valuable. To achieve this, try A/B testing different visuals, copy, and calls-to-action (CTAs) to see what resonates most. Fine-tuning your targeting can also help ensure your ads reach users who are more likely to engage.
CPC gives you a clear picture of how efficiently you’re spending on ads, paving the way for a deeper dive into overall ad performance in the next section.
21. Return on Ad Spend (ROAS)
ROAS, or Return on Ad Spend, goes beyond basic cost metrics like CPC (Cost Per Click) to measure how much revenue your ad campaigns generate for every dollar spent.
Here’s how it works: ROAS is calculated by dividing the revenue generated from an ad campaign by the total cost of running that campaign. For example, if you spend $1,000 on ads and earn $2,000 in revenue, your ROAS is 2:1. This ratio is often expressed as a figure like 5:1, meaning $5 in revenue for each $1 spent on ads.
Why does this matter? ROAS helps pinpoint which ads are driving the most profit, making it easier to decide where to allocate your budget. Unlike ROI, which looks at overall profitability, ROAS zeroes in on ad spend specifically. This makes it an essential tool for connecting your social media efforts directly to revenue.
Industry benchmarks for ROAS can vary. On average, a 2:1 ROAS is considered decent across most industries, though many businesses aim for a 4:1 ratio or higher. For niche markets or products with high profit margins, a ROAS of 10:1 is often the goal. To figure out your breakeven ROAS, divide 1 by your profit margin. For instance, if your profit margin is 25%, you’d need a ROAS of at least 4:1 to break even.
Improving ROAS involves using tools like Facebook Pixel, Google Analytics, and UTM parameters to track revenue. Experiment with A/B testing for ad formats, visuals, and copy to find what resonates most with your audience. Boosting click-through rates can also make a big difference - platforms often reward engaging ads with better placement and lower costs. Keep an eye on performance across platforms and shift your budget toward the channels delivering the best results.
"It's key to achieve a low cost per conversion so you can make money (instead of losing money) from your social ads." – Margot Whitney, Content Marketing Specialist, WordStream
Conclusion
Keeping track of these 21 social media engagement metrics transforms likes, clicks, views, and shares into actionable insights for growth. Without regular measurement, it’s tough to separate what truly resonates from what doesn’t.
These metrics don’t just guide your strategy - they also connect the dots between engagement and revenue. In fact, research shows that 65% of marketing leaders need to prove how social media supports business goals to gain leadership approval. Using tools like UTM parameters, A/B testing, and social listening can help tie social activity to measurable outcomes, making it easier to allocate budgets effectively and improve ROI. Plus, high engagement rates signal to platform algorithms that your content is worth promoting, potentially boosting organic reach without extra ad spend.
"Social media metrics are the vital data points that track the performance and impact of your social channels, content, and strategy. These insights transform raw data into a clear roadmap for growth..." - Sprout Social
At SEO Werkz, the focus is on data-driven strategies that help businesses zero in on metrics that truly drive conversions and ROI. Through tailored social media marketing campaigns, content creation, and detailed monthly reporting, SEO Werkz ensures your social efforts translate into measurable outcomes. Their team leverages advanced analytics tools and UTM tracking to monitor referral traffic, spot potential issues early, and adapt strategies based on real-time data.
Aligning your metrics with business goals is the key to long-term success. With SEO Werkz’s comprehensive approach, your social media strategy is built on solid data, fine-tuned for performance, and designed to deliver consistent growth. By prioritizing these essential metrics, your strategy stays focused, effective, and ready to deliver results.
FAQs
Which engagement metrics matter most for my business goals?
The key social media engagement metrics you should focus on will depend entirely on your business goals. If you're aiming to boost brand awareness, prioritize metrics like reach and impressions - these help you understand how many people are seeing your content. On the other hand, if your focus is on lead generation or conversions, keep an eye on click-through rates (CTR), conversions, and your engagement rate (which looks at likes, comments, and shares compared to your follower count). The trick is to align these numbers with your goals and consistently track them to fine-tune your approach and get the most out of your efforts.
How do I track conversions and ROAS from social media accurately?
To get an accurate read on conversions and ROAS (Return on Ad Spend), it's crucial to set up the right tools. Implement conversion tracking mechanisms like pixels or tags on your site to capture key actions - whether that's a purchase, a sign-up, or another goal.
Leverage attribution models to understand how different touchpoints in the customer journey contribute to conversions. This will help you analyze ROAS more effectively. Also, make it a habit to review your data and tracking setup regularly. This ensures everything is working correctly, and you can fine-tune your approach as needed.
What’s the difference between reach, impressions, and views?
Reach, impressions, and views are three distinct ways to understand how audiences interact with your content:
- Reach: The count of unique individuals who have seen your content at least once.
- Impressions: The total number of times your content is displayed, even if it's shown multiple times to the same person.
- Views: The number of times video or multimedia content is actively watched.
Each of these metrics highlights a different aspect of your social media performance, helping you analyze and refine your strategy effectively.