5 Steps to Tailor Marketing Reports for Stakeholders
July 23, 2026Most marketing reports fail for one simple reason: they treat every reader the same. If I want better decisions, I need to build reports around who is reading them, what they need to decide, and which 3–5 KPIs matter most.
Here’s the short version:
- Step 1: I match each stakeholder to the decisions they make.
- Step 2: I pick a small set of KPIs tied to business goals.
- Step 3: I explain what happened, why it happened, and what to do next.
- Step 4: I change the layout, charts, and detail level by audience.
- Step 5: I turn findings into action items with an owner, deadline, and success metric.
A CEO may care about revenue, CAC, and ROI. A marketing manager may need conversion rate, CPL, and channel performance. A sales leader may focus on SQL rate, close rate, and deal size. Same data, different decisions.
One useful rule stands out: if a metric does not help the reader make a decision, I cut it.
| Step | What I focus on | Main outcome |
|---|---|---|
| 1 | Stakeholders | The report fits one main audience |
| 2 | KPIs | Only the top numbers lead |
| 3 | Narrative | Results are tied to causes and next steps |
| 4 | Format | The report is easy to scan |
| 5 | Actions | Each finding leads to a clear follow-up |
The main idea is simple: a report should work like a decision tool, not a data dump.
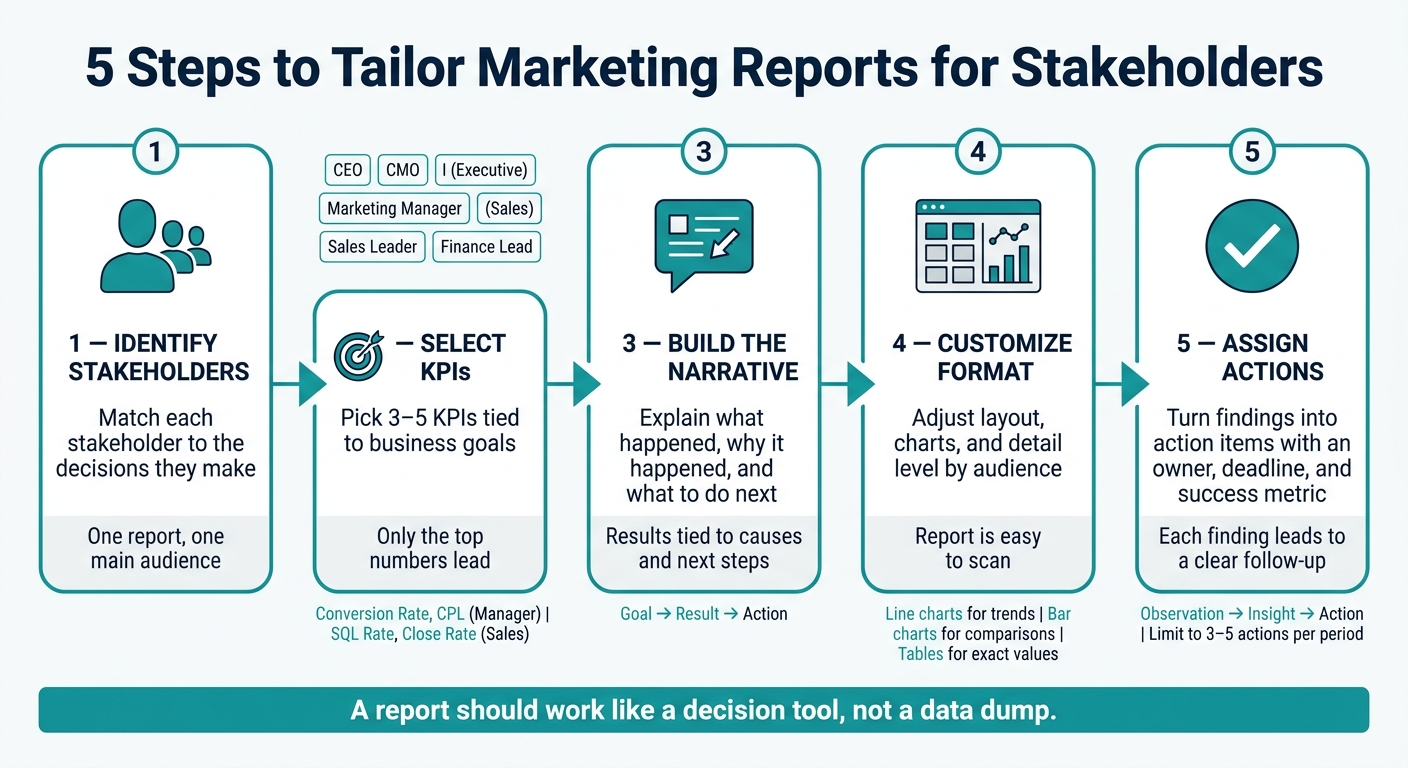
5 Steps to Tailor Marketing Reports for Stakeholders
How to build marketing reports that actually drive decisions
sbb-itb-cef5bf6
Step 1: Identify Your Stakeholders and the Decisions They Make
Before you pick even one metric, figure out who will read the report. And don’t stop at job titles. Tie each person to the decisions they make.
A CEO wants to know where the budget should go and whether marketing is helping the company grow. A marketing manager wants to know which campaigns to stop and which ones to scale. Those are not the same questions, so they shouldn’t get the same report.
Your report should reflect the decisions each reader needs to make, not just dump data on the page.
Build one report for one main audience. If other people need updates too, give them a short summary or a separate view.
A simple way to stay on track is to ask: "What decision will this person make after reading this?" If a metric doesn’t help answer that, cut it. Once you know who the report is for, you can choose KPIs that line up with the decisions they own.
Map Roles to Decisions and Reporting Frequency
Each role works on its own rhythm. Executives tend to review strategy monthly or quarterly. Marketing managers need weekly signals so they can adjust campaigns. Sales leaders want to see whether leads are coming in and whether those leads are worth pursuing. Finance teams need numbers that line up with the budget.
Here’s a simple map of common stakeholder roles, the decisions they own, how often they need updates, and the format that tends to work best.
| Stakeholder Role | Primary Decisions | Update Frequency | Preferred Format |
|---|---|---|---|
| CEO / Business Owner | Budget approval, revenue growth | Monthly or quarterly | One-page executive summary or dashboard snapshot |
| CMO / Marketing Director | Channel mix, budget allocation | Weekly + monthly close | Slide deck or dashboard with channel-level commentary |
| Marketing Manager | Campaign optimization, creative tests, bid adjustments | Weekly | Detailed dashboard with conversion rates, ROAS, and trend lines |
| Sales Leader | Lead quality review, pipeline prioritization, follow-up strategy | Weekly or biweekly | Lead volume and conversion report tied to campaigns |
| Finance Lead | Spend efficiency, ROI validation, budget reconciliation | Monthly | Spreadsheet or KPI summary with actuals vs. budget |
With the audience and reporting cadence set, Step 2 is about choosing the metrics that matter most.
Step 2: Match Business Goals to the Right KPIs
Once Step 1 defines the audience, the next move is simple: pick the small set of KPIs that shows whether each business goal is on track.
The key is to use the decisions from Step 1 to guide KPI selection. If the goal is revenue growth, the top line should focus on revenue, marketing-sourced pipeline value, CAC, and marketing ROI or ROAS.
A good rule of thumb: limit each audience to 3–5 primary KPIs that directly show success or failure.
Everything else belongs in the supporting bucket. Those numbers still matter. They help explain why something moved. But they shouldn't lead the report. For instance, bounce rate can help a marketing manager make sense of a traffic drop, but it shouldn't be the first number a CEO sees.
Pick 3 to 5 Core KPIs for Each Audience
The table below links each stakeholder to the business goal they care about, the main KPIs tied to that goal, the supporting metrics that add context, and the system where the data lives.
| Stakeholder | Business Goal | Primary KPIs | Supporting KPIs | Data Source |
|---|---|---|---|---|
| Executive (CEO/CMO) | Grow revenue and profitability | Monthly revenue ($), Pipeline value ($), CAC ($), Marketing ROI or ROAS | CLV, Churn rate, Channel contribution (%) | CRM (Salesforce, HubSpot), Accounting tools |
| Marketing Manager | Generate qualified leads efficiently | Leads per month, Conversion rate (%), CPL ($), Performance by channel | CTR (%), Bounce rate (%), Email open/click rates | Google Analytics, Ads platforms, Email tools |
| Sales Leader | Improve close rate and deal quality | SQL rate (%), Close rate (%), Avg. deal size ($), Sales cycle length (days) | Lead response time | CRM (HubSpot, Pipedrive), Call tracking |
| Paid Media Specialist | Optimize ad performance and ROAS | ROAS, CPC ($), CPM ($), CTR (%) | Quality score, Impression share (%) | Google Ads, Meta Ads, Analytics |
| Content/SEO Lead | Increase organic visibility and traffic | Organic sessions, Keyword rankings, Organic leads | Click-through from SERP, Engagement metrics | Google Search Console, Analytics, SEO platforms |
If you're unsure whether a metric belongs in the primary or supporting column, run it through three fast checks:
- Directness: Does it tie straight to the business goal?
- Decision relevance: Would a change in this number make the stakeholder do something different?
- Simplicity: Can they understand it without a long explanation?
If the answer is no to any of those, move it to supporting or remove it.
Format Metrics for U.S. Audiences
For U.S. stakeholders, consistency matters more than people think. A messy format can make a solid report feel sloppy.
Use one style for currency, dates, and large numbers across the whole report.
Currency uses a dollar sign, commas for thousands, and a period for decimals: $5,000, $42.50, $1,250,000.
When you're showing change over time, keep that format steady. Example: CPL dropped from $52.10 in May to $39.75 in June.
Dates use month-day-year order, written as July 24, 2026, or 07/24/2026 in numeric form.
For reporting periods, be specific: Reporting Period: July 1–31, 2026 or Q3 2026 (July 1–September 30, 2026).
Large values should always include comma separators: 25,000 sessions, 1,250,000 impressions.
Don't mix styles in the same report. It sounds small, but it makes a difference.
A clean executive summary might read like this:
Total revenue for June 2026 was $220,000, up from $195,000 in May. CAC fell to $310.25 from $345.90 last quarter. Marketing ROI held at 3.8x against a 4.0x target.
With the right KPIs and formatting in place, Step 3 turns the numbers into a clear narrative.
Step 3: Build a Clear Report Narrative Around Results
Numbers on their own don't tell people what matters. When a report opens with a big block of metrics, stakeholders have to figure out the meaning for themselves, and in most cases, they won't. This step turns the KPIs from Step 2 into a story people can use to make decisions. That story starts in the executive summary.
Start With an Executive Summary
Open with a one-page summary that answers three simple questions: Are we on track? What changed? What should happen next? Write it in plain English, use active voice, and skip the jargon so readers can move fast and know what to do.
Use a Goal, Result, and Action Flow
For each major initiative, use a simple three-part flow: Goal → Result → Action. Start with the goal. Then show the result, explain what drove it, and spell out the next step with an owner and due date.
Keep the same flow for every audience. What changes is the level of detail. Executives need the decision. Managers need the driver. Specialists need the cause. But that extra detail should sit in a supporting section, not in the main narrative.
Before you add a chart or table, stop and ask: does it support the goal, result, or action? If the answer is no, move it to the appendix or cut it. Step 4 turns that narrative into the right layout and chart choices.
Step 4: Adjust Layout, Charts, and Detail Level by Stakeholder
Use the layout to put the KPIs tied to each stakeholder’s decisions front and center, then place the supporting detail underneath. That way, the story from Step 3 stays easy to scan instead of getting buried.
Choose Charts That Match the Question
Each chart should answer one question. Keep it simple:
- Use line charts for trends
- Use bar charts for comparisons
- Use tables for exact values
Put the main KPIs at the top of each page: revenue, total leads, and ROAS.
Format Reports Differently for Executives, Managers, and Specialists
Match the level of detail to the person reading the report. Executives usually want a one-page summary with headline KPIs and a clear status call. Managers need channel-level sections that show what’s driving results. Specialists need tables, segment breakdowns, budget spend vs. plan, and campaign-level data in supporting tabs or appendices so they can dig in.
Use this structure to match the level of detail to the audience.
| Stakeholder Type | Top-of-Page Elements | Core Chart Types | Detail Level | Preferred Format |
|---|---|---|---|---|
| Executive | Revenue, ROAS, Total Leads | Line charts (trends) | Low - strategic | One-page summary |
| Marketing Manager | Channel ROI, Goal Progress | Bar charts (comparisons) | Medium - tactical | Multi-section report |
| Specialist | CPC, CTR, Keyword Rankings | Tables, granular data | High - technical | Detailed tabs or appendices |
Once readers can spot the right metrics fast, turn those findings into owners, deadlines, and next steps.
Step 5: Turn Report Findings Into Clear Next Actions
After KPIs and layout, the next call is simple: who owns the fix, when it starts, and how success will be tracked.
A report that stops at results is only half done. The part that matters most is what happens next: the action, the owner, the due date, and the expected result.
Use Observation, Insight, and Action
Use Observation → Insight → Action to turn findings into assigned next steps. This is the execution layer of the Goal → Result → Action flow from Step 3.
Here’s a compact example. Google Ads generated 120 leads at $40 CPL with a 15% close rate in June, while Facebook Ads generated 200 leads at $25 CPL but only a 5% close rate. The insight is clear: Google leads close at three times the rate, which makes Google the stronger ROI driver even with the higher CPL. The action: reallocate 20%–30% of the Facebook budget to Google Ads in July and track closed revenue by channel weekly.
If your report shows lead response time slipped from 1 hour to 10 hours, the action should be just as clear: implement a routing rule that requires response within 2 business hours, add an auto-response for new form fills, and aim to restore the close rate from 12% to 18% within 60 days. That’s when a report becomes useful to each stakeholder, not just a stack of numbers.
For each recommendation:
- assign an owner
- set a deadline in standard U.S. date format, such as 09/30/2026
- define the success metric upfront
Keep each reporting period to 3–5 actions so small teams don’t get buried. Then carry an Action Status section into the next report to show what was completed, what’s in progress, what stalled, and how KPIs changed.
Conclusion: A 5-Step Checklist for Better Reporting
Use this checklist before sending the report:
- Identify stakeholders - Confirm the audience and the decisions they own.
- Select the right KPIs - Limit each audience to 3–5 core metrics tied to business goals, in U.S. formats.
- Structure a clear narrative - Lead with an executive summary; organize around goals, results, and what they mean.
- Customize layout and visuals - Match chart types and detail level to each stakeholder.
- Turn insights into action - Apply Observation → Insight → Action to every major finding, with owners, deadlines, and expected impact.
Effective reporting leads to better decisions. When every report ends with clear next steps, it helps teams make smarter budget calls and improve ROI.
FAQs
How do I choose one main audience for a report?
Start by getting clear on which business decisions the report needs to support. That part matters more than most people think. If the report is meant to guide budget shifts, team staffing, sales priorities, or campaign changes, the metrics should point straight at those choices.
Next, identify who will use the report. A report for an executive team should not look like one built for channel managers or frontline sales leads. Different people care about different signals, and when you cram everything into one page, the message gets muddy fast.
Build a one-page brief that covers:
- Goals: What the report is supposed to help people decide or act on
- Target audience: The main group the report is for
- Key metrics: The small set of numbers that best fits that audience’s job
Keep the brief tight and specific. If the report’s main purpose is to help a marketing lead improve campaign performance, focus on metrics tied to that job. If it’s for a finance leader reviewing spend, center the brief on cost and return. Mixing metrics across groups usually creates noise instead of clarity.
Pick the audience closest to the report’s main purpose, then shape the goals and metrics around that group. That gives the report a clear job and makes it much easier to use.
What if different stakeholders need the same report?
If several stakeholders need the same report, don't lump everyone into one view. A report that mixes top-line business numbers with deep tactical metrics usually ends up helping no one.
A better move is to use smart filters or dynamic dashboards inside one template. That way, each person sees the data that matters most to them, like business outcomes for executives and channel analytics for managers. SEO Werkz specializes in these custom-tailored deliverables.
How often should marketing reports be updated?
Update marketing reports based on what they’re meant to do and what your stakeholders need.
Daily updates make the most sense for active campaigns where teams may need to make same-day changes. Weekly reports are a good fit for routine performance tracking. And monthly reports work best for high-level summaries, trend reviews, and longer-term work like SEO.
It also helps to line up your reporting schedule with how often your data sources refresh. That way, your reports stay accurate and complete.