
10 Google Data Studio Templates for Campaign Analysis
March 21, 2026Google Data Studio (now Looker Studio) makes campaign reporting easier by turning raw data into clear visuals. It connects to over 500 platforms like Google Ads, GA4, and Facebook Ads, automating real-time updates. Templates save time by offering pre-built dashboards for tracking metrics like ROI, conversions, and engagement across PPC, SEO, and email campaigns.
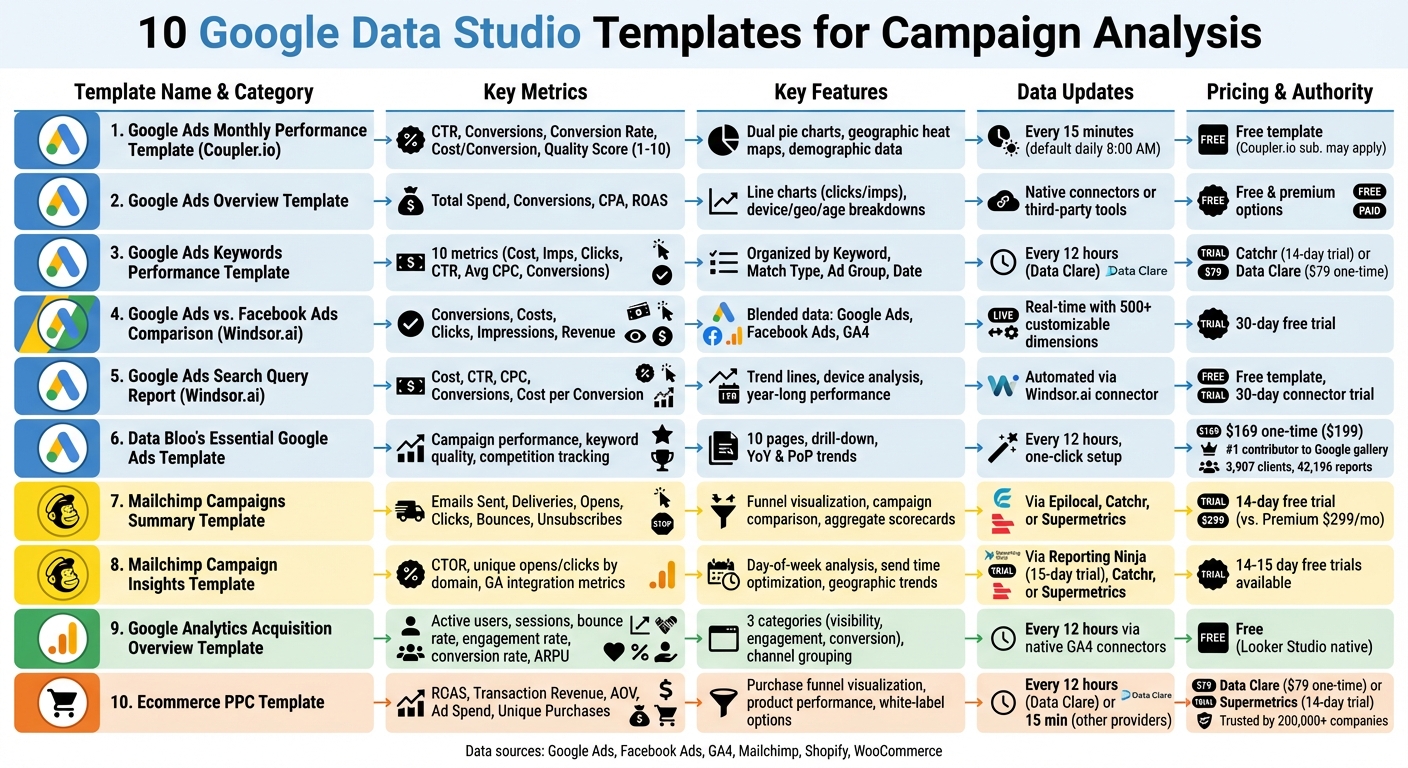
Here’s a quick look at 10 useful templates:
- Google Ads Monthly Performance Template: Tracks CTR, conversions, and ROI with automated updates.
- Google Ads Overview Template: Provides a snapshot of spend, CPA, and ROAS.
- Google Ads Keywords Performance Template: Focuses on keyword-level metrics to optimize campaigns.
- Google Ads vs. Facebook Ads Comparison Template: Combines data for cross-platform analysis.
- Google Ads Search Query Report Template: Analyzes search terms for better keyword targeting.
- Data Bloo's Google Ads Template: Offers deep campaign insights with drill-down features.
- Mailchimp Campaigns Summary Template: Summarizes email performance with delivery, open, and click rates.
- Mailchimp Campaign Insights Template: Identifies patterns like best send times and audience engagement.
- Google Analytics Acquisition Overview Template: Tracks traffic sources and conversion metrics.
- Ecommerce PPC Template: Monitors ROAS, product sales, and ad performance for online stores.
These templates simplify reporting, save hours of manual work, and help you make faster, data-driven decisions.
10 Google Data Studio Templates for Campaign Analysis Comparison
Google Data Studio dashboard - Spend Tracking Template overview
sbb-itb-cef5bf6
1. Google Ads Monthly Performance Template by Coupler.io
This free tool simplifies monthly reporting and planning by focusing on key metrics. It connects directly to your Google Ads account using Coupler.io's built-in connector, pulling data automatically - no need for manual CSV exports. This automation makes it easier to track and analyze performance.
The dashboard covers crucial metrics like CTR, conversions, conversion rate, cost per conversion, and conversion value. Dual pie charts provide a clear comparison of spend allocation versus conversion performance, helping you identify campaigns with the best ROI. Additionally, geographic heat maps offer insights into regional performance, along with demographic data like age, gender, and device type.
You can schedule data updates as frequently as every 15 minutes (default is once daily at 8:00 AM). Monthly trend charts and a keyword performance table highlight seasonal trends and conversion details, making it easier to fine-tune your budget.
A Quality Score tracker (rated 1–10) evaluates how relevant your keywords, ads, and landing pages are. The dashboard also shows your Search Impression Share, which reflects the percentage of available impressions your ads capture. A side-by-side comparison of spend versus conversions helps you quickly spot areas to reallocate your budget for better results.
Setting up the template is quick and takes only a few minutes, thanks to the included guide. While the template itself is free, you may need a Coupler.io subscription depending on how often you refresh data or the volume of information you handle.
2. Google Ads Overview Template
This template offers a clear snapshot of your entire Google Ads account, making it simple to evaluate account health and spot performance trends quickly. It serves as a starting point for tracking detailed performance metrics.
The dashboard includes scorecards for Total Spend, Conversions, CPA, and ROAS, all with comparisons to previous periods. Additionally, line charts plot clicks and impressions over daily, weekly, or monthly intervals, helping you spot performance shifts at a glance.
Designed to complement more detailed templates, this overview focuses on delivering essential account-level insights. Setting it up is straightforward: copy the template, link your data source, and watch the dashboard populate with your data. You can connect directly to Google Ads via Looker Studio's native connectors or third-party tools like Windsor.ai.
"Building a template from scratch takes time and a well-designed dashboard require an analytical and business understanding of the data sources." – 3pie Analytics
The template also provides detailed breakdowns by device, geography, age, and campaign. Interactive filters allow for quick analysis of date ranges or account switching. Options include both free and premium templates, making it accessible for a range of budgets.
3. Google Ads Keywords Performance Template
Once you've analyzed broader account metrics, it's time to zoom in on the details. This template is designed for keyword-level performance tracking, offering a precise way to optimize your campaigns.
It tracks 10 key metrics such as Cost, Impressions, Clicks, CTR, Average CPC, Total Conversions, Conversion Rate, and Cost per Conversion. Plus, it includes competitive insights like "Search lost absolute top Impression Share" caused by budget or rank issues.
The data is organized by Keyword, Match Type, Ad Group, and Date, making it easy to compare strategies across broad, phrase, and exact match types. This approach helps uncover high-intent keywords while flagging underperformers for potential exclusion as negative keywords.
To streamline the process, you can integrate Google Ads data using no-code tools like Catchr or Data Clare. Catchr offers a free plan with a 14-day trial for its connector subscription, while Data Clare requires a one-time payment of $79 and updates every 12 hours.
"A must-have template if you are serious about Google Ads. It's a great way to extract good info. from SEO data and use in Google Ads campaigns." – Green Peas, Verified User
The template also includes robust filtering options to isolate specific ad groups. This allows you to evaluate which match types deliver the best ROI. For example, keywords with high conversions but low impression shares could indicate bidding opportunities. On the flip side, keywords with high costs but zero conversions should be excluded to prevent wasted spend.
4. Google Ads vs. Facebook Ads Comparison Template by Windsor.ai
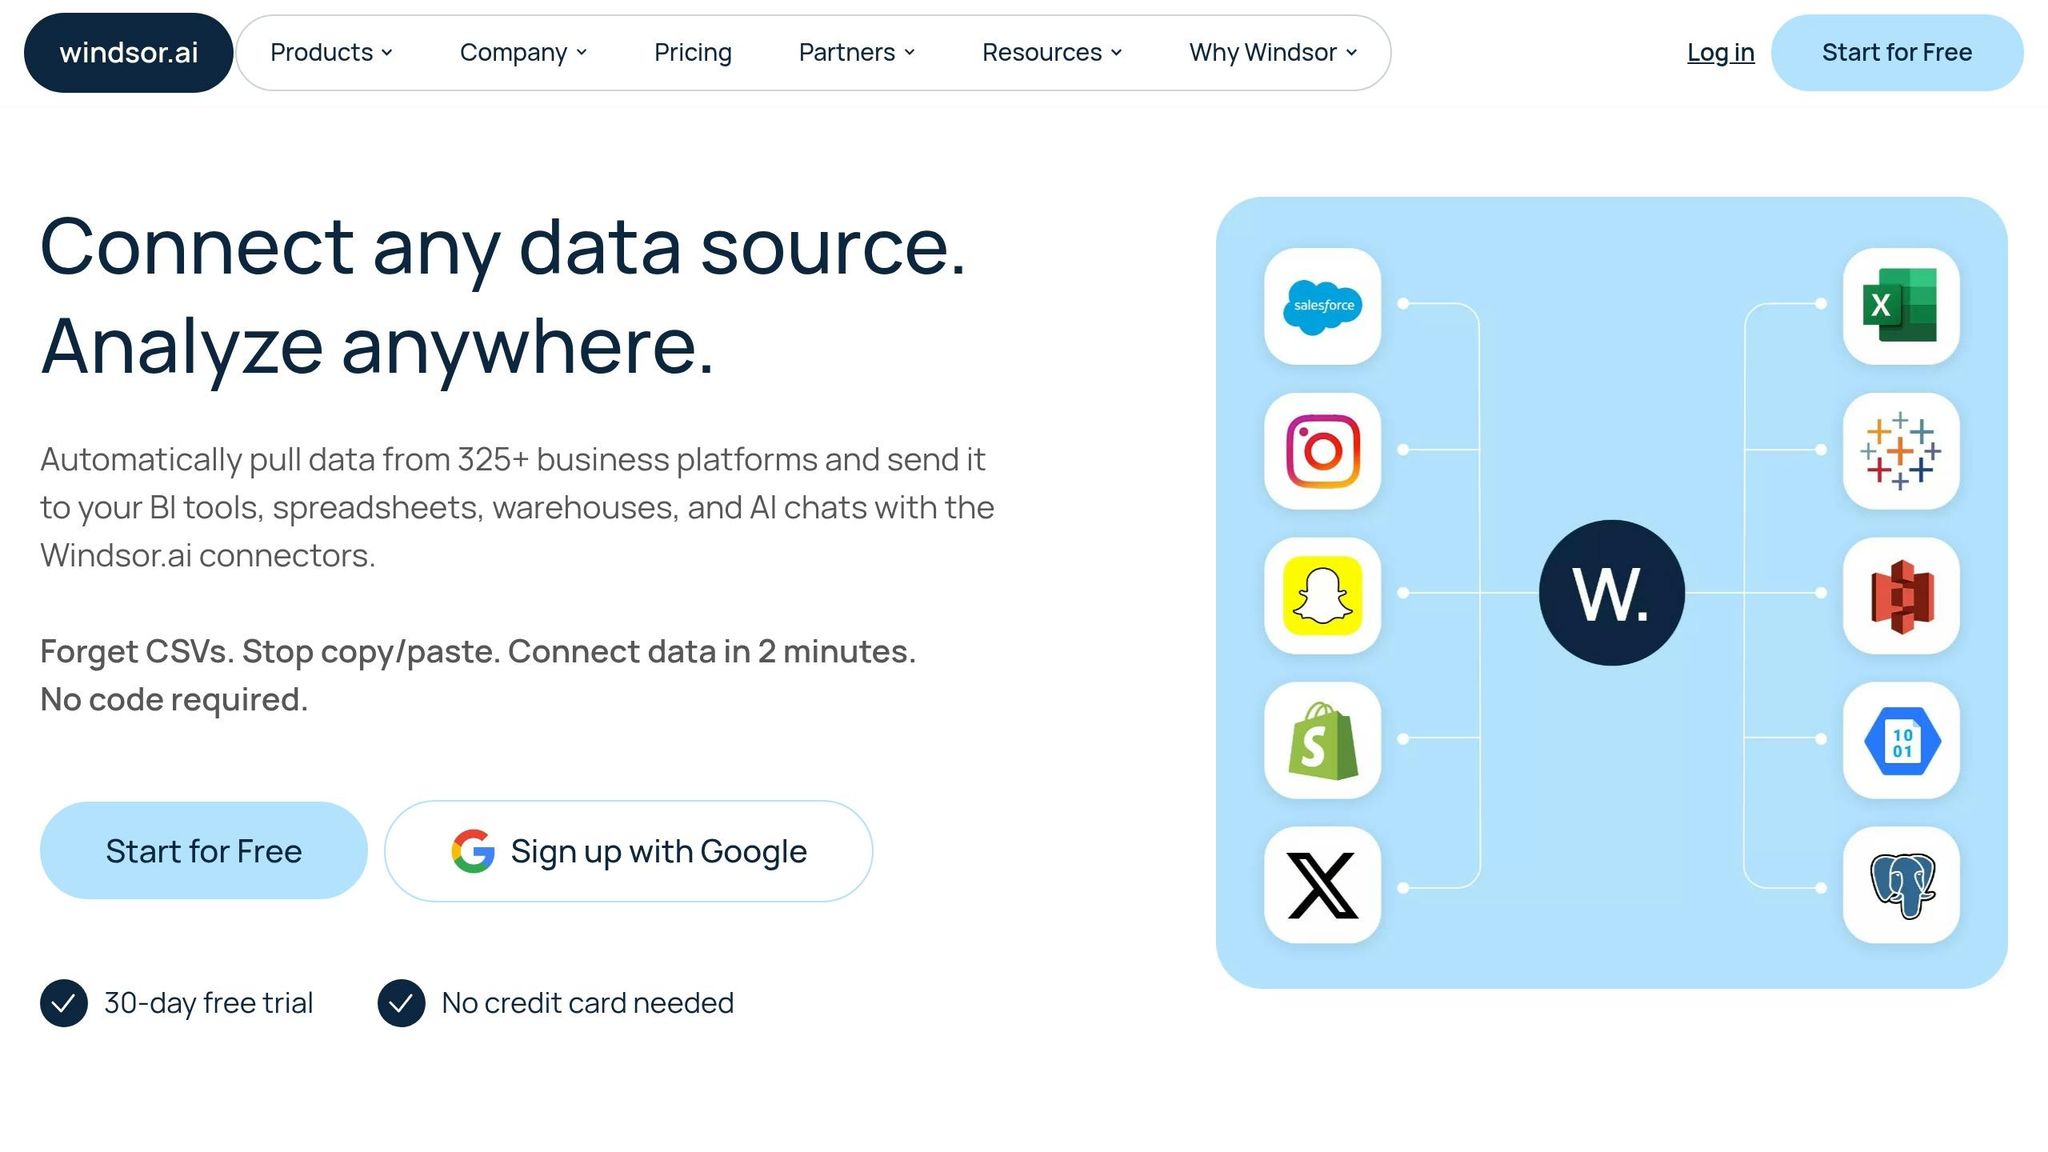
Managing multiple advertising platforms can quickly scatter your data, making it harder to analyze performance. This template simplifies the process by combining metrics from Google Ads and Facebook Ads into a single, unified view.
It pulls data from Google Analytics 4, Google Ads, and Facebook Ads, merging key metrics like conversions, costs, clicks, and impressions. This gives you a clear picture of how your campaigns and channels are performing, all in one place.
Key Metrics Tracked
| Metric Category | What's Tracked | Data Source |
|---|---|---|
| Cost & Reach | Spending, Clicks, Impressions | Google Ads & Facebook Ads |
| Conversion | Leads, Purchases, Revenue | Google Analytics 4 |
| Analysis Levels | Channel Level, Campaign Level | Blended Data |
These metrics are the backbone of effective cross-channel analysis, helping you compare performance across platforms with accuracy.
Important Setup Tips
To get the most out of this template, ensure your Facebook Ads are tagged with UTM parameters. Without proper tagging, Google Analytics might misattribute conversions, leaving you with incomplete data for comparison.
Once you've copied the template, double-check all filters to confirm that the data is displayed correctly across platforms.
Additional Features
Windsor.ai provides a 30-day free trial to explore the template and its connectors. With access to over 500 customizable dimensions and metrics, you can track KPIs tailored to your needs. Plus, you can make further adjustments using Looker Studio's "Edit" mode.
5. Google Ads Search Query Report Template by Windsor.ai
If you're running Google Ads campaigns, knowing the exact search terms that trigger your ads can make a huge difference. This template from Windsor.ai digs deeper than basic keyword data, offering detailed insights into the specific queries users type before clicking your ads. It’s a powerful way to understand user intent and improve campaign performance. Here’s how you can set it up and make the most of its metrics.
Start by signing up on Windsor.ai, linking your Google Ads account, and selecting Looker Studio through the "Google Ads by Windsor.ai" community connector. The best part? No coding or messy CSV exports are required for setup.
Once connected, the template provides a clear view of search term performance. It tracks key metrics like cost, CTR, CPC, conversions, and cost per conversion, allowing you to compare current results with past performance. Trend lines show how queries have performed over the last year, helping you spot seasonal trends and patterns.
| Metric Category | What It Tracks |
|---|---|
| Cost & Efficiency | Spend, CPM, CPC, Cost per Conversion |
| Engagement | Clicks, CTR, Impressions, Number of Search Terms |
| Conversion | Conversions, Conversion Rate, Revenue |
With these insights, you can refine your campaigns by eliminating irrelevant queries and adding high-performing ones to your keyword list. The template also lets you analyze performance across devices, so you can see if specific queries work better on mobile or desktop. Plus, it’s free to use, with a 30-day trial for the Windsor.ai connector available.
6. Data Bloo's Essential Google Ads Template
Data Bloo's Essential Google Ads Template stands out as a versatile tool in the world of Google Data Studio templates. With its one-click setup, all you need to do is connect your Google Ads account using the native Looker Studio connector. Once linked, the data refreshes automatically every 12 hours, keeping your reports up-to-date without manual intervention.
The dashboard is thoughtfully organized across 10 pages, covering everything from campaign performance and keyword analysis to geolocation, audience insights, and even competition tracking. One of its standout features is the drill-down functionality, which allows you to click on a chart and dive deeper into the details - no need to jump between views.
For campaign and keyword analysis, this template really delivers. The Campaign Mining table lets you filter campaigns by their status - active, paused, or deleted - making it easier to compare performance. The Keyword Quality Score segment highlights underperforming keywords that might be eating up your budget unnecessarily. Additionally, you can monitor Year-on-Year (YoY) and Period-on-Period (PoP) trends to evaluate how your campaigns are progressing over time.
The Competition Trends page is another standout feature. It tracks metrics like Overlap Rate and Outranking Share, giving you a clear picture of where you stand against competitors. These insights are invaluable for refining your bidding strategies based on actual data rather than assumptions.
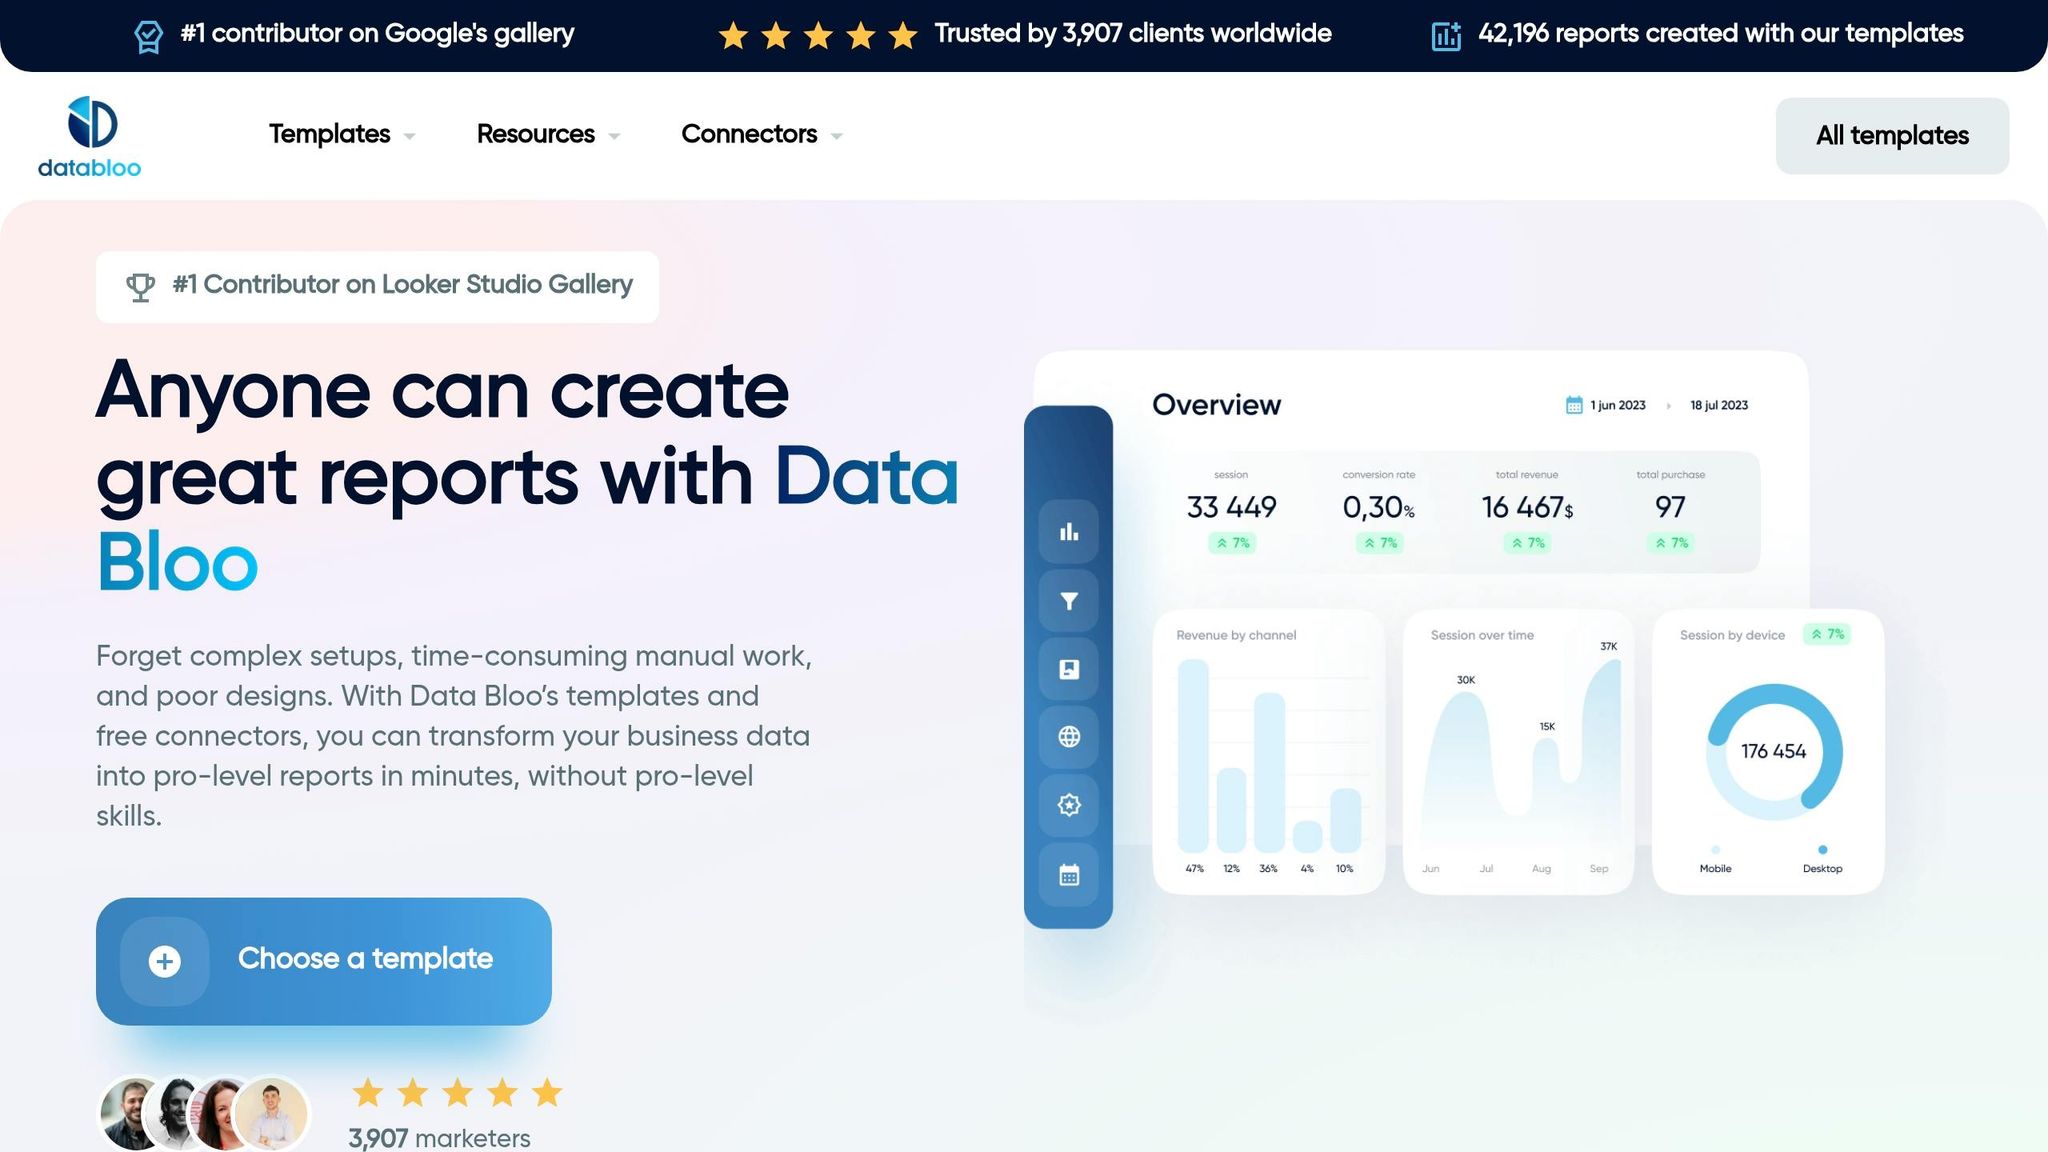
Data Bloo's credibility in this space is noteworthy. They are the #1 contributor to Google's official Looker Studio gallery, boasting 3,907 clients globally and over 42,196 reports created using their templates. The Essential Google Ads Template is available for a one-time payment of $169 (discounted from $199), with no recurring fees.
With its detailed layout and ability to provide actionable competitive insights, this template is a strong option for marketers looking to optimize their Google Ads performance.
7. Mailchimp Campaigns Summary Template
This template shifts the focus to analyzing email campaign performance. By using connectors like Epilocal, Catchr, or Supermetrics, you can pull Mailchimp data directly into Looker Studio. Most of these connectors come with a free 14-day trial, giving you a chance to test them out.
One standout feature is its ability to consolidate data from all your campaigns into a single, unified view. As Epilocal explains:
"Mailchimp has built-in campaign reports that give you a wealth of information, but they are also static and lack the ability to customize to your needs".
Without this template, comparing campaigns side-by-side requires a Mailchimp Premium plan, which costs $299 per month. Similar to PPC templates, this tool simplifies campaign analysis, making it easier to draw insights.
The template tracks essential metrics like Emails Sent, Successful Deliveries, Unique Opens, Unique Clicks, Bounces, and Unsubscribes. It also calculates delivery, open, click, and unsubscribe rates. A funnel visualization highlights the journey from email delivery to opens and clicks, giving you a quick snapshot of performance.
Interactive filters make it easy to sort data by date range, specific Mailchimp audiences (lists), or campaign titles. Detailed tables let you drill down into individual campaigns, subject lines, or lists, enabling direct comparisons. These features help you quickly identify what’s working and where improvements are needed. For instance, if open rates are low, you can pinpoint which subject lines are underperforming and adjust accordingly.
Bounce rates are another critical metric to monitor. High bounce rates often indicate poor list quality, suggesting it might be time to clean your lists or use double opt-in methods. Additionally, aim to keep your unsubscribe rate below 0.5%. The template’s aggregate scorecards make it easy to benchmark overall performance and spot campaigns that either exceed or fall short of your account averages.
With its detailed insights and user-friendly design, this template is a powerful tool for refining your email marketing strategy. It’s all about giving you the clarity you need to optimize campaigns and connect better with your audience.
8. Mailchimp Campaign Insights Template
This template digs deeper than basic reports, helping you understand why some Mailchimp campaigns perform better than others. It's perfect for marketers who want to uncover the key drivers behind campaign success. By connecting to Mailchimp through third-party tools like Reporting Ninja (which offers a 15-day free trial), Catchr, or Supermetrics (both with typical 14-day free trials), you can unlock insights that help fine-tune your campaign timing and content strategy.
Unlike a simple summary, this template dives into behavioral and timing data. It breaks down performance by day of the week, highlights the best times to send emails based on past engagement, and tracks trends by country or region. For instance, it can reveal if your audience is more active on specific days or if certain locations see better engagement.
It also tracks unique opens and clicks by domain (like Gmail, Yahoo, or Outlook), helping you spot any potential deliverability issues. By analyzing CTOR (click-to-open rate) and link-specific engagement, you can identify which content resonates most with your audience. Plus, integration with Google Analytics allows you to monitor on-site actions like sessions, bounce rates, and conversions - whether those are purchases, sign-ups, or downloads - giving you a clear picture of how your campaigns drive real results.
This tool is all about refining your strategy. For example, if the data shows that emails sent at 10:00 AM on Wednesdays consistently perform best, you’ve found your ideal timing. You can also identify which subject lines and sender names generate the highest engagement, then replicate those elements in future campaigns. With these insights, you can fine-tune your schedules and content to keep your audience engaged over the long term.
9. Google Analytics Acquisition Overview Template
This template links directly to Google Analytics 4 (GA4) to provide a clear view of traffic sources and their performance metrics. It's tailored for marketers who need insights into acquisition channels such as organic search, paid ads, social media, and referrals. By using Looker Studio's native connectors, it pulls live data, eliminating the need for manual updates and ensuring you always have up-to-date information. This real-time data forms the basis for analyzing user behavior and conversion outcomes.
The template organizes data into three key categories: visibility, engagement, and conversion metrics. It showcases essential metrics like active users, new users, and sessions, alongside engagement measures such as bounce rate, engagement rate, and average session duration. For e-commerce sites, it also tracks purchase revenue, conversion rates, and average revenue per paying user (ARPU). This setup allows you to quickly pinpoint which channels not only generate traffic but also drive conversions.
Data is segmented by default channel grouping, source/medium, campaign name, and landing page, enabling you to shift from broad trends to more detailed insights. For instance, organic search often generates the most traffic, while paid search typically delivers higher conversion rates. Interactive filters make it easy to refine your analysis further, allowing you to compare date ranges, switch between GA4 properties, or focus on specific campaigns or regions. Some versions even combine GA4 data with Google Search Console and Google Ads for a unified view of both organic and paid performance. You can also integrate data from other sources to build a more complete picture of your campaign efforts.
Looker Studio is free and supports a wide range of connectors, making it simple to expand this template with data from platforms like Facebook Ads or Mailchimp. Data sources refresh every 12 hours, so to maintain accurate channel reporting, use consistent UTM parameters and enable auto-tagging.
10. Ecommerce PPC Template
This template is built for online retailers who need to monitor key metrics like ROAS, product performance, and conversion value. It pulls data from web analytics tools, paid media platforms (such as Google Ads, Facebook, TikTok, Snapchat, and Pinterest), and ecommerce platforms like Shopify, offering a comprehensive view of your store's performance. Joy Huynh, Content Strategist at Supermetrics, highlights its utility, saying, "the template is perfect for ecommerce marketers who want a 360 view of their ecommerce performance, including website, product, and marketing performance".
The template focuses on essential financial metrics such as ROAS, total transaction revenue, average order value (AOV), and total ad spend. It also includes a purchase funnel visualization, helping you understand the customer journey - from browsing product lists to adding items to the cart and initiating checkout. This feature identifies where potential customers abandon the process, giving you actionable insights. Additionally, it supports flexible pricing and synchronization options to suit different business needs.
For pricing, Data Clare offers this template at a one-time fee of $79, with data syncing every 12 hours. Supermetrics provides a 14-day free trial for their Looker Studio ecommerce templates, which are trusted by over 200,000 companies in 120 countries. Shopify users can integrate by authorizing the connector app to access store data, while WooCommerce users will need to generate a REST API key with "Read/Write" permissions in their WordPress settings.
The template provides detailed performance breakdowns by campaign, keyword, geographic location, and customer type (new versus returning). It tracks unique purchases, revenue per product, and top sellers. This level of detail helps you identify high-intent, low-cost keywords while eliminating ineffective ads. For example, tracking unique purchases versus total transactions can reveal bulk buying trends. If a product has high transaction numbers but fewer unique purchases, offering bulk discounts could boost sales.
For agencies, the template includes white-label features for branding purposes. Automated data refreshes ensure your metrics stay up-to-date, with some providers offering updates as frequently as every 15 minutes, allowing you to monitor near real-time sales and inventory levels.
Conclusion
Google Data Studio templates simplify the process of data analysis by eliminating the need for tedious .csv downloads and manual chart creation. These templates allow marketers to track campaign performance across PPC, SEO, and social media channels in a single, automated dashboard. By centralizing data from platforms like Google Ads, Facebook Ads, and Search Console, they provide an all-in-one solution for monitoring and reporting.
"Google Data Studio takes the raw data and puts it into easy-to-understand reporting through visualization." – Search Engine Land
For agencies such as SEO Werkz, these templates transform complex datasets into actionable insights, helping deliver measurable ROI. The white-label features make it easy to create professional, branded reports, while real-time data integration ensures metrics stay up-to-date, enabling faster, more informed decision-making. In fact, over 10,000 marketing teams and agencies across 60 countries rely on these automated templates to streamline their workflows.
Additionally, Google Data Studio bypasses the limitations of the Google Analytics API, which restricts users to 10 metrics and 7 dimensions per application. This flexibility makes it easier to generate more comprehensive and detailed reports. With an extensive library of Looker Studio templates, marketers can customize dashboards to track key metrics like ROAS, conversion rates, keyword rankings, and email campaign performance. Whether you're focused on paid search, organic traffic, or ecommerce analytics, these templates save time by delivering granular, actionable data for future optimization.
These tools are designed to help marketers act quickly and effectively:
"Save hours of work with our click and ready Google Data Studio Template. Just select the one you want and start to get data and take decision for your business." – Catchr
FAQs
Which template should I start with for my campaign reporting?
Looker Studio offers ready-made templates tailored for SEM, SEO, and Paid Media campaigns. These templates are designed to give you a clear and organized way to track and analyze your marketing efforts. With their detailed reporting features, they make it easier to dive into the performance of your campaigns and identify trends or opportunities for improvement. Whether you're focusing on search engine marketing, optimizing for organic traffic, or managing paid media, these templates provide a solid foundation for your reporting needs.
Do I need UTM tags and auto-tagging for accurate attribution?
UTM tags and auto-tagging play a key role in ensuring accurate attribution. By using these tools, you can track the source, medium, and campaign details of your traffic and conversions. This level of detail allows you to measure performance with precision, giving you the insights needed to understand how your marketing efforts are driving results. With this data, you can make informed decisions to fine-tune and improve your campaigns.
How often should I refresh Looker Studio data for reliable dashboards?
When you need the latest information, it's essential to refresh your Looker Studio data. This ensures your dashboards stay reliable and up-to-date. Actions like opening a report or making changes prompt Supermetrics connectors to automatically update the data. Similarly, refreshing the report or reloading the page triggers these updates seamlessly.