10 Metrics to Track Real-Time Campaign Impact in E-commerce
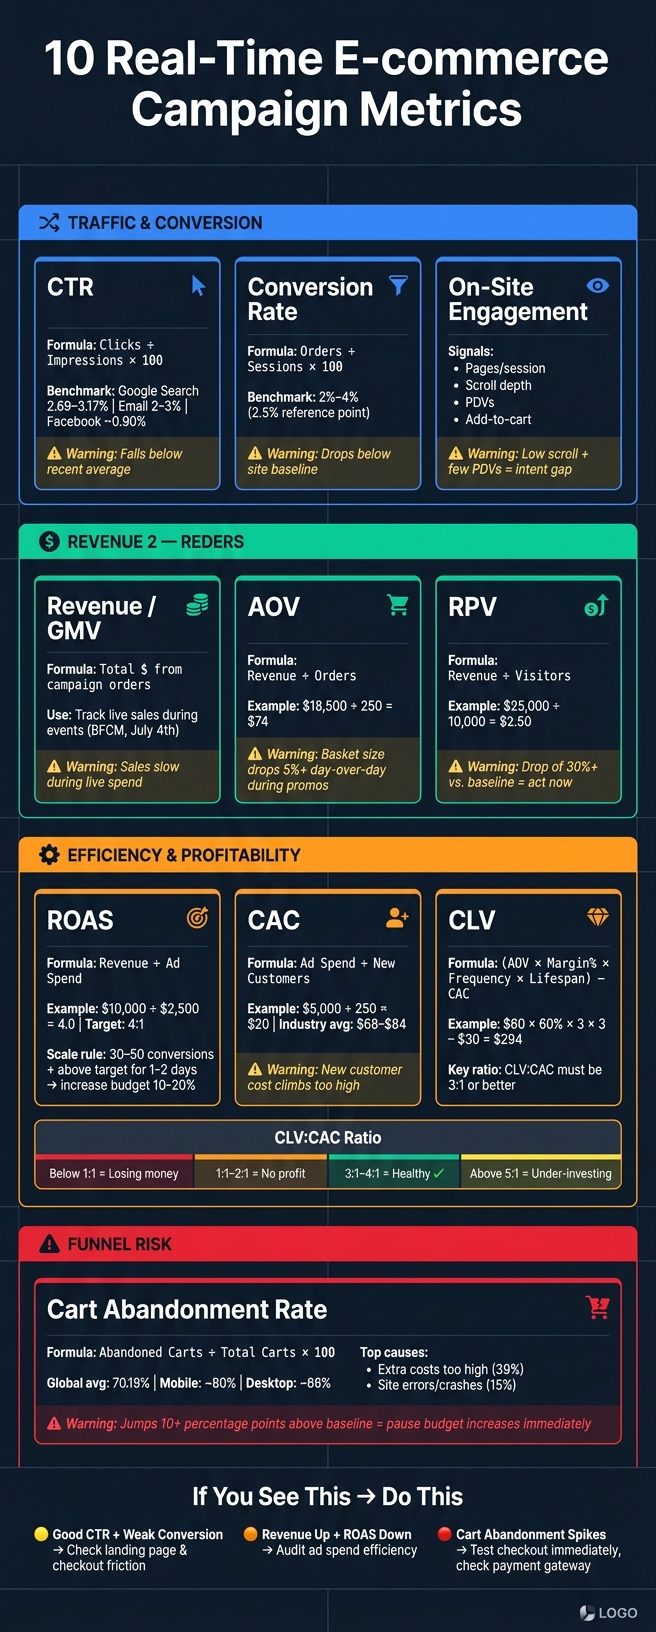
July 17, 2026If I want to know whether an e-commerce campaign is working today, I watch 10 numbers: CTR, conversion rate, on-site engagement, revenue/GMV, AOV, RPV, ROAS, CAC, CLV, and cart abandonment. That set tells me if traffic is clicking, buying, spending enough, and getting through checkout without friction.
Here’s the short version:
- Traffic quality: CTR, conversion rate, and on-site engagement show if the right people are landing on the site.
- Sales impact: Revenue/GMV, AOV, and RPV show if those visits are turning into enough sales.
- Spend efficiency: ROAS, CAC, and CLV show if the campaign can keep running at a profit.
- Funnel risk: Cart abandonment shows if checkout problems are killing sales.
A few benchmarks stand out right away:
- A common e-commerce conversion range is 2%–4%
- A practical ROAS target is often around 4:1
- A healthy CLV:CAC ratio is usually 3:1 or better
- Global cart abandonment is about 70.19%
- A drop of 30%+ in RPV or a jump of 10 percentage points+ in cart abandonment should get attention fast
If I see good CTR but weak conversion rate, I look at the landing page or checkout. If revenue is up but ROAS is down, I look at spend efficiency. If cart abandonment spikes, I test checkout right away.
10 E-commerce Campaign Metrics: What to Track, Watch & Act On
Ecommerce Marketing Analytics: Top 8 Metrics EXPLAINED
sbb-itb-cef5bf6
Quick Comparison
| Metric | What it tells me | Simple warning sign |
|---|---|---|
| CTR | Are people clicking? | Click rate falls below recent average |
| Conversion rate | Are visitors buying? | Rate drops below site baseline |
| On-site engagement | Are visitors showing intent? | Low scroll, few PDVs, low add-to-cart |
| Revenue / GMV | Is money coming in? | Sales slow during live spend |
| AOV | Are orders large enough? | Basket size falls during promos |
| RPV | How much is each visitor worth? | RPV drops 30%+ |
| ROAS | Is ad spend paying off? | ROAS falls below target |
| CAC | What does a new customer cost? | New customer cost climbs too high |
| CLV | Are acquired customers worth it? | CLV:CAC falls under 3:1 |
| Cart abandonment | Is checkout leaking sales? | Abandonment jumps 10 points+ |
In other words: I’d use these metrics as a live checklist, not as separate reports. The goal is simple - spot weak traffic, weak pages, weak profit, or a broken checkout before the campaign burns through more budget.
Checklist Part 1: Traffic and Conversion Metrics to Watch First
These three metrics are your first line of defense. They show whether your campaign is bringing in the right people and whether those people are turning into buyers.
1. Click-Through Rate (CTR)
CTR = (Clicks ÷ Impressions or Sends) × 100
CTR shows how often people click after they see your ad, email, or listing.
Check CTR by channel and placement because averages can swing a lot. Google Search often lands between 2.69% and 3.17%, Facebook sits around 0.90%, display is near 0.5%, and email usually falls between 2% and 3%
If CTR starts sliding in the middle of a campaign, the cause is usually pretty simple. The creative may not be catching attention, the audience may be off, or the subject line or send time may not be doing its job. When CTR falls well below its recent average for more than a couple of hours, act fast. Swap in new creative, narrow the audience, or test a different subject line before more spend leaks out.
2. Conversion Rate from Campaign Traffic
Conversion Rate = (Campaign Conversions ÷ Sessions or Clicks) × 100
This metric tells you whether campaign visitors are actually buying.
A solid e-commerce conversion rate usually falls in the 2% to 4% range, with 2.5% often used as a common reference point If your rate drops hard below its recent baseline, treat that as a warning sign.
You can calculate this metric using sessions or clicks. Sessions usually give a better view of what happens on the site, since one person might click the same ad more than once. Clicks connect more directly to ad spend. For day-to-day monitoring, sessions often give the cleaner read on landing page performance.
Here’s the big clue: if CTR looks good but conversion rate looks weak, the issue usually sits on the page. That might mean slow load times, a broken promo code, shipping costs that show up too late, or a checkout flow with too much friction. If conversion rate suddenly drops across several campaigns at once, that’s a red flag for a sitewide problem, like a payment gateway issue or bad tracking, and your engineering team should check it right away.
3. On-Site Engagement from Campaign Visitors
A lot of clicks can look good at first glance. But if people leave almost right away, those clicks don’t mean much.
That’s why it helps to watch a small group of engagement signals together:
- Pages per session
- Average session duration
- Scroll depth
- Product detail views (PDVs)
- Add-to-cart actions
Taken together, these metrics show whether campaign visitors are moving toward product discovery and purchase
Low scroll depth on a landing page often means the top of the page isn’t connecting. Very few PDVs or add-to-cart events usually mean visitors aren’t even making it to the shopping stage.
When click volume looks strong but engagement is weak, there’s often a gap between what the ad promised and what the landing page delivers In plain English, people clicked for one thing and landed on something else. The fix is usually direct: match the landing page headline and offer to the ad, and send traffic to the exact product or category page mentioned instead of a generic homepage. You can also tighten targeting around recent site visitors or cart abandoners to cut down on low-intent clicks before they eat into your budget.
If these three metrics look steady, the next step is to check revenue and order metrics to see whether sales are moving with them.
Checklist Part 2: Revenue and Order Metrics That Show Immediate Sales Impact
If traffic is converting, the next step is simple: check whether it’s bringing in enough money to make the spend worth it. These three metrics give you that answer fast.
4. Campaign Revenue or Gross Merchandise Value (GMV)
Campaign Revenue = Total dollar value of completed orders attributed to a specific campaign
GMV = gross sales before refunds, taxes, and shipping
Campaign revenue tells you how much money a campaign is bringing in. GMV gives you a top-line view of sales volume, which is especially useful for marketplaces or multi-vendor businesses.
During major U.S. shopping events like Black Friday, Cyber Monday, or July 4th sales, watch these numbers closely throughout the day. That live view helps you shift budget, pause weak ads, or extend an offer before the day is over.
For cleaner attribution, use unique UTMs, make sure pixels are firing, and stick to one attribution window. Then reconcile platform revenue with store data each day.
5. Average Order Value (AOV)
AOV = Campaign Revenue ÷ Campaign Orders
Example: $18,500 ÷ 250 orders = $74 AOV
AOV shows whether your offer setup is getting customers to spend more per order. If AOV stays flat or slips during a discount campaign, shoppers may be using the promo on small, one-item carts. That can eat into margin fast.
A few tactics tend to move AOV up:
- Product bundles priced a bit below the combined price of buying items one by one
- Tiered discounts, such as Spend $50, get 10% off; spend $100, get 20% off
- Free shipping thresholds set about 15% to 30% above your current baseline AOV
Keep an eye on swings of 5% or more day over day. A 10% to 20% lift often gives you room to scale, while a drop usually points to weaker offers or weaker upsells.
6. Revenue Per Visitor (RPV)
RPV = Campaign Revenue ÷ Campaign Visitors
Example: $25,000 ÷ 10,000 visitors = $2.50 RPV
RPV blends conversion rate and AOV into one number. That makes it one of the fastest ways to compare campaign performance across channels in real time.
If RPV drops by 30% or more versus your recent baseline, that usually means one of two things: the offer isn’t hitting as hard, or the traffic is less qualified. Split it back into conversion rate and AOV to see where the problem is.
If revenue looks strong, the next thing to check is whether it’s efficient enough to scale.
Checklist Part 3: Efficiency and Profitability Metrics for Live Budget Decisions
Strong revenue can look great on the dashboard and still leave you with thin margins. That’s why these three metrics matter when you need to make budget calls in the moment. Start with ROAS, then check CAC and CLV to see if growth still makes financial sense.
7. Return on Ad Spend (ROAS)
ROAS = Campaign Revenue ÷ Ad Spend
Example: $10,000 in revenue on $2,500 in ad spend = 4.0 ROAS (or 4:1)
ROAS gives you the fastest read on whether a campaign is paying its way. A 4:1 ROAS is a practical target for profit, so it works well as your first budget signal.
Match ROAS against your channel target, and don’t scale too soon. Wait until it stays above target for 1–2 days with enough volume behind it.
If ROAS holds above target for 1–2 days and you’ve logged 30–50 conversions, increase budget by 10%–20%. If it drops below breakeven, lower bids or pause the campaign.
If ROAS still looks good, move to CAC. That tells you whether the campaign is staying efficient at the customer level.
8. Customer Acquisition Cost (CAC)
CAC = Total Acquisition Spend ÷ New Customers Acquired
Example: $5,000 in ad spend ÷ 250 new customers = $20 CAC
CAC shows what you pay to bring in each new customer. Use the version that updates fastest. For live decision-making, track CAC based on media spend. For monthly reviews, use full-cost CAC.
Full-cost CAC should include items like:
- Creative costs
- Agency fees
- Software costs
Keep those extra costs in monthly CAC, not in real-time CAC. Average e-commerce CAC is estimated at $68 to $84, though the number changes a lot by vertical. Apparel often lands around $30–$60, while home and furniture can run above $120.
One detail matters a lot here: divide by new customers only. If you include returning buyers, your acquisition cost will look lower than it is.
Once you know the acquisition cost, the next step is simple: check whether those customers are worth enough over time.
9. Customer Lifetime Value (CLV) by Campaign
CLV = (AOV × Gross Margin % × Purchase Frequency × Customer Lifespan) − CAC
Example: $60 AOV × 60% margin × 3 purchases/year × 3 years − $30 CAC = $294 CLV
Use CLV to decide which campaigns can support a higher acquisition cost. On its own, CAC tells you what you paid. CLV tells you what that customer may return over time.
The main number to watch is the CLV:CAC ratio. A 3:1 ratio is the minimum healthy target.
| CLV:CAC Ratio | What It Signals |
|---|---|
| Below 1:1 | Losing money on each customer |
| 1:1 – 2:1 | Acquiring customers without meaningful profit |
| 3:1 – 4:1 | Healthy and scalable |
| Above 5:1 | Likely under-investing in growth |
Use campaign-level CLV to support higher CAC for high-value buyers, and trim spend on discount-only traffic.
Checklist Part 4: Funnel Risk Metrics and Dashboard Setup
Once traffic, revenue, and ROAS look solid, check the bottom of the funnel before scaling spend.
10. Cart Abandonment Rate
Cart Abandonment Rate = Abandoned Carts ÷ Total Carts Created × 100
Example: 850 abandoned carts out of 1,000 created = 85% abandonment rate
The global average is about 70.19%, based on Baymard Institute's aggregated research. If your rate climbs above your store's normal baseline during a live campaign, act fast.
A sharp jump usually comes from one of four issues: shipping or tax costs that show up late in checkout, payment failures or missing payment methods, site errors or crashes, or mobile usability problems. Baymard's data found that extra costs that feel too high drive 39% of abandonments, while site errors or crashes account for 15%.
Device splits matter here. Mobile abandonment is around 80%, compared with roughly 66% on desktop, so this metric should be segmented by device.
If abandonment rises by more than 10 percentage points above baseline in the middle of a campaign, treat it as a high-risk warning. Pause budget increases, place a test order to reproduce the issue, and review your payment gateway status plus shipping rules before turning full spend back on.
Build a simple real-time dashboard for all 10 metrics
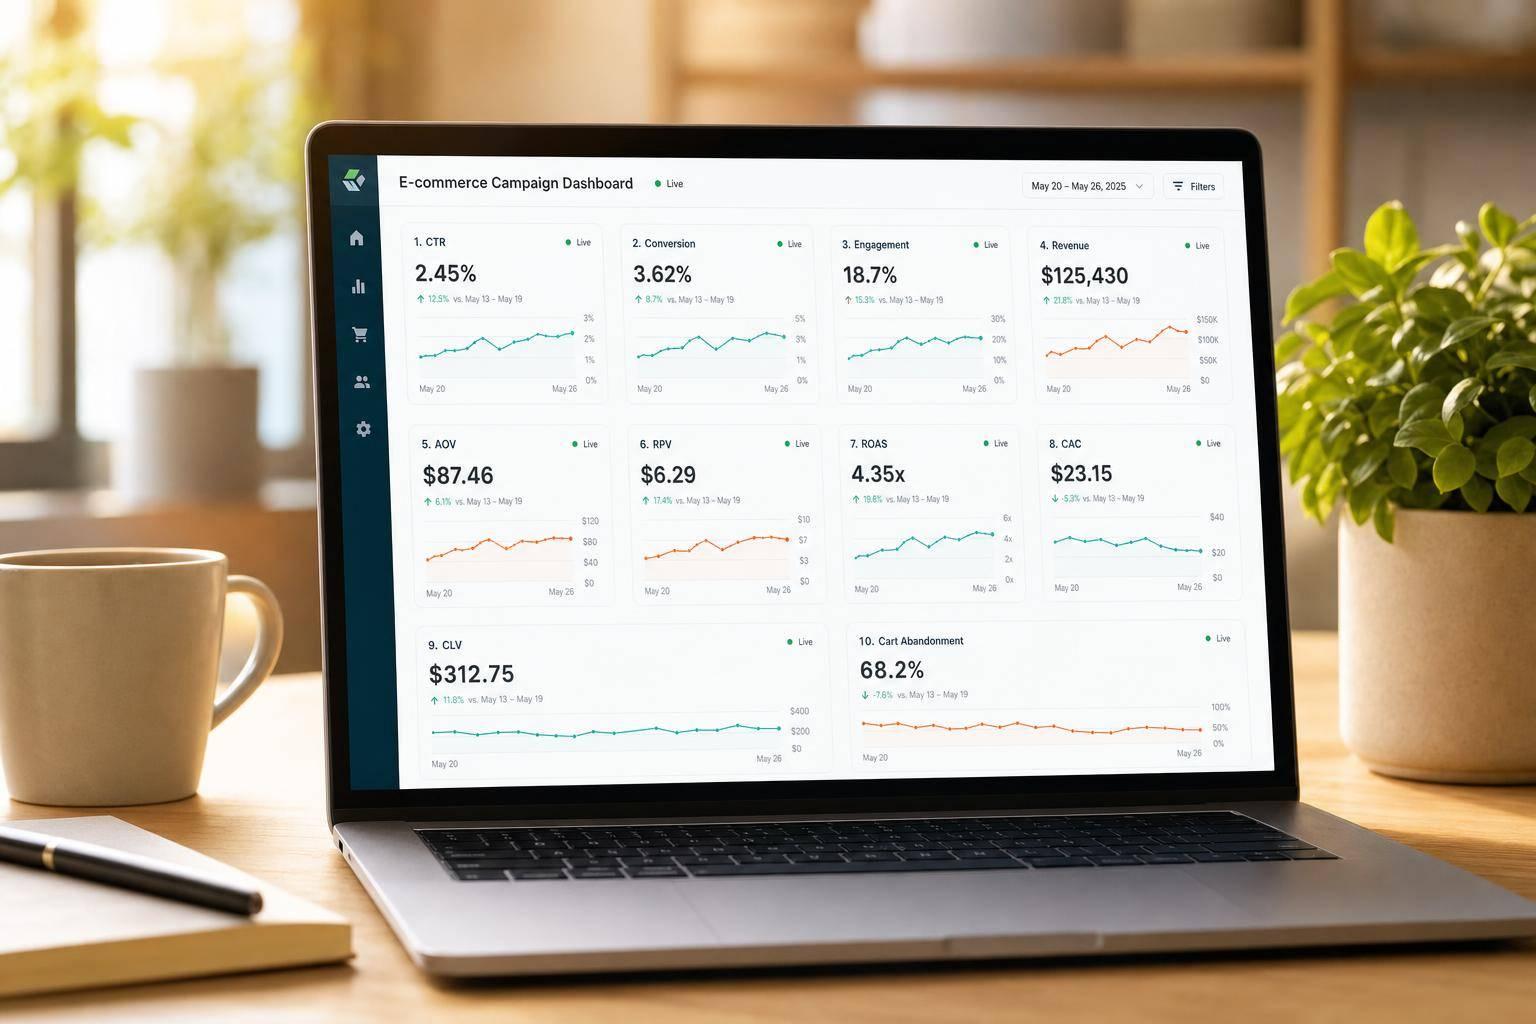
Group the metrics into traffic, revenue, efficiency, and funnel risk so problems stand out fast. Use green, amber, and red based on your past baselines, and keep the dashboard to 10–15 tiles on a single screen so anyone on the team can read it at a glance. The table below works as a live dashboard layout.
| Metric | Formula | Primary Real-Time Use | Risk if Ignored |
|---|---|---|---|
| CTR | Clicks ÷ impressions × 100 | Checks ad and targeting performance | Spend leaks into weak ads |
| Conversion rate | Orders ÷ sessions × 100 | Shows whether visitors are buying | Spend keeps flowing to traffic that doesn't convert |
| On-site engagement | Engagement events, time on site, pages/session | Shows landing page quality | Weak pages stay hidden |
| Campaign revenue / GMV | Total revenue from campaign orders | Tracks direct sales impact | Revenue drops aren't spotted until the campaign is over |
| AOV | Revenue ÷ orders | Monitors changes in basket size | Margin loss from discounts slips by |
| RPV | Revenue ÷ visitors | Combines traffic volume and monetization | High traffic with low yield can look better than it is |
| ROAS | Revenue ÷ ad spend | Helps shift budget during the campaign | Ad spend outruns returns |
| CAC | Marketing spend ÷ new customers | Tracks customer acquisition efficiency | Gross sales hide profit issues |
| CLV by campaign | Projected value over customer life | Measures the quality of acquired customers | Low-value buyers get overrated at campaign level |
| Cart abandonment rate | Abandoned carts ÷ total carts created × 100 | Spots checkout friction | Bugs, fee shock, and payment issues keep hurting sales |
Conclusion: The 10 fastest campaign-impact signals
No single metric tells the whole story. You need to read traffic, revenue, and profit together. These 10 metrics cover the four areas that matter most: volume, conversion, revenue, and profitability. Cart abandonment works like the warning light on the dashboard when something breaks.
For small and mid-sized teams, the aim is simple: one screen that answers three things fast: Is traffic up? Is revenue keeping pace? Is checkout breaking? That shift matters. It means spotting problems while the campaign is still live instead of finding them after the money is already spent.
SEO Werkz can help build the unified tracking and attribution setup that turns these 10 metrics into a live decision system.
FAQs
Which metrics should I check first during a live campaign?
Start with metrics that confirm technical performance and immediate engagement. Look at conversion events like add-to-cart actions, plus click-through rate (CTR) and real-time traffic volume.
Use GA4 to make sure tracking codes and UTM parameters are working as expected. Then check Shopify for live store or checkout issues before they lead to abandoned carts or lost revenue.
How often should I monitor these e-commerce campaign metrics?
It depends on your campaign goals and the kind of work you're running. Real-time tools can show top-performing ads and technical issues within minutes or hours. That makes them a good fit for flash sales and new launches, where timing matters.
For general reporting, weekly check-ins usually work well for fast-moving paid search campaigns or the first 90 days of a new initiative. More established work, like SEO, often makes more sense on a monthly review cycle. Automated dashboards help you keep a steady view of performance without having to pull the same reports by hand every time.
What should I do if CTR is high but conversions stay low?
A high click-through rate paired with low conversions usually means the ad is doing its job. People see the message, it lines up with what they want, and they click.
The trouble starts after the click.
Run a funnel analysis to see exactly where visitors drop off. That gives you a clear view of the weak spot instead of forcing you to guess. Then use real-time monitoring to catch problems as they happen, like slow page loads, confusing checkout steps, or payment gateway errors.
You can also look at heatmaps and session recordings to spot landing page engagement issues. If people hesitate, rage-click, or leave halfway through the page, that’s often where the friction lives.