How to Analyze Post-Campaign Audience Behavior
March 22, 2026Want to make your next campaign better than the last? Post-campaign audience behavior analysis is the key to understanding what worked, what didn’t, and how to improve. Here’s what you need to know:
- Data is everything. Companies using data are 23x better at acquiring customers and 19x more likely to stay profitable.
- Track all channels. Use tools like Google Analytics, Facebook Ads Manager, and Salesforce to collect data from websites, social media, email, and paid ads.
- Focus on metrics that matter. Engagement rates, conversion rates, and behavioral data like bounce rates and session duration reveal what drives results.
- Advanced techniques work. Multi-touch attribution, cohort analysis, and incrementality testing uncover deeper insights about your audience’s journey.
- Turn insights into action. Use findings to fix drop-off points, reallocate budgets, and refine messaging for better ROI.
How to Track & Analyze Campaigns in Google Analytics 4 (GA4)
sbb-itb-cef5bf6
Collecting Your Post-Campaign Data
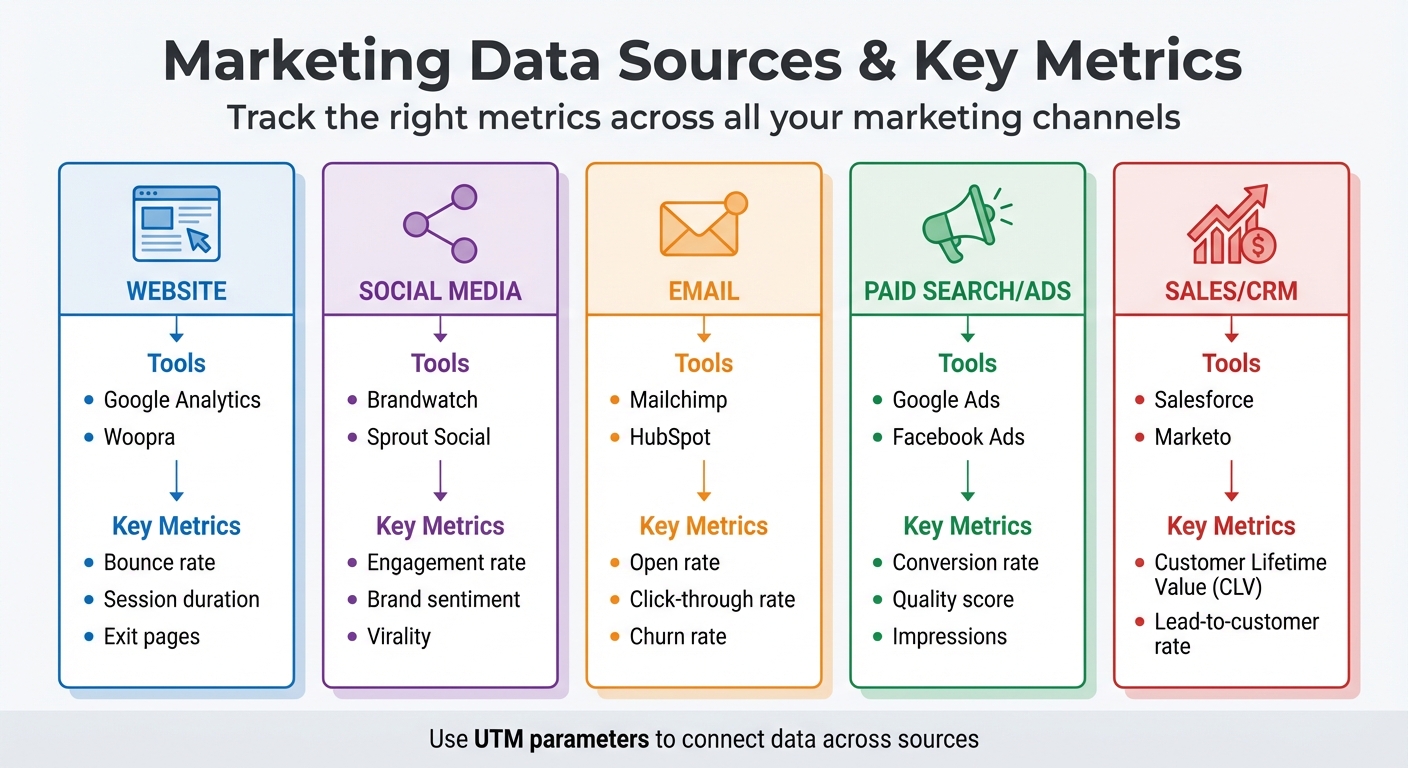
Marketing Data Sources and Key Metrics Comparison Guide
To understand how your campaign performed, you need to gather data from every touchpoint. This means looking beyond a single Google Analytics report. A full analysis requires pulling information from all the platforms where your audience engaged with your brand.
Find Your Key Data Sources
Different channels offer their own analytics tools, each tailored to specific types of engagement. For example:
- Website analytics tools like Google Analytics or Woopra track visitor behavior on your site, capturing metrics such as bounce rates, session lengths, and exit pages.
- Social media platforms provide built-in analytics. Tools like Facebook Ads Manager, LinkedIn Campaign Manager, and Instagram Insights deliver data on reach, engagement (likes, shares, comments), and follower growth.
- Email marketing platforms - such as HubSpot, Mailchimp, or Marketo - offer insights into open rates, click-through rates, and unsubscribe trends.
- Paid ad reports from platforms like Google Ads or Facebook Ads focus on financial performance metrics like Cost Per Click (CPC) and Return on Ad Spend (ROAS).
- Your CRM system (e.g., Salesforce) can connect campaign activity to real-world outcomes, such as purchases or customer lifetime value.
One essential tool for tying all this data together is UTM parameters. These tags let you add specific identifiers - like source, medium, and campaign name - to your URLs. This way, you can trace exactly which channel or message brought visitors to your site. Without UTM tags, traffic might show up as "direct" or "referral", making it harder to pinpoint its origin.
| Data Source Category | Common Tools | Key Metrics |
|---|---|---|
| Website | Google Analytics, Woopra | Bounce rate, session duration, exit pages |
| Social Media | Brandwatch, Sprout Social | Engagement rate, brand sentiment, virality |
| Mailchimp, HubSpot | Open rate, click-through rate, churn rate | |
| Paid Search/Ads | Google Ads, Facebook Ads | Conversion rate, quality score, impressions |
| Sales/CRM | Salesforce, Marketo | Customer Lifetime Value (CLV), lead-to-customer rate |
Once you've gathered your data, the next step is to ensure it's accurate and complete.
Check Data Accuracy and Completeness
Raw data can be messy, so it’s crucial to validate its accuracy before diving into analysis. Start by cleaning up your data. For example, filter out internal traffic using IP filtering to ensure employee activity doesn’t skew your results. If you notice unusual spikes in untracked channels or referral traffic, it could mean tracking links are broken and need fixing.
Whenever possible, automate your data collection. Automated tools minimize human error, which is common with manual data entry. Platforms like Camphouse or Segment can pull data from multiple sources into a single dashboard, making it easier to spot discrepancies. For instance, if Facebook reports 500 conversions but your website analytics only show 350, you may have a tracking issue that needs investigation.
Cross-check your numbers to ensure consistency. Break down data by device type (mobile vs. desktop) and compare metrics like bounce rates to industry benchmarks. A bounce rate between 26% and 40% is considered excellent, while rates above 70% might signal engagement problems or tracking errors. Tools like Hotjar or Microsoft Clarity can help confirm whether your data aligns with user behavior by providing heatmaps and session recordings.
Accurate data is the foundation for understanding your campaign’s success, so take the time to get it right.
Choosing the Right Metrics to Track
Once you've gathered data, it's time to zero in on metrics that actually influence your business goals. Not all numbers are created equal - some may look impressive but have little impact, while others provide a clear picture of your performance.
The key is to align your metrics with your campaign's objectives. For instance, if you're aiming to boost brand awareness, focus on exposure metrics. If driving sales is your goal, conversion metrics should take center stage. Keith Kakadia, Founder of Sociallyin, sums it up perfectly:
"Every social media post either builds your business or drains your budget. Running a campaign without a clear measurement strategy is like exploring uncharted territory without a map".
With accurate data in hand, choosing the right metrics ensures your analysis leads to actionable insights. Metrics can generally be grouped into three main categories: engagement, conversion, and behavioral. Each type serves a different purpose - engagement reflects how your audience interacts, conversion shows whether your efforts drive results, and behavioral data uncovers why users take (or don’t take) action. Let’s dive into engagement metrics first.
Engagement Metrics
Engagement metrics track how actively your audience interacts with your content. These include likes, comments, shares, saves, and reposts . High engagement can amplify your organic reach, as platforms tend to favor content with strong interaction - potentially saving you money on ad spend.
But don’t just look at raw numbers. To get a more accurate view, calculate engagement as a percentage of total reach or impressions. For example, while 1,000 likes may seem like a lot, if your content reached 100,000 people, that’s just a 1% engagement rate. For video campaigns, prioritize metrics like average watch time and completion rates rather than simply counting views.
Another valuable tool is brand sentiment analysis, which categorizes audience mentions as positive, negative, or neutral. This helps gauge public perception and emotional responses to your campaign . Additionally, tracking Share of Voice (SOV) shows how much of the industry conversation your brand dominates. In fact, 94% of business leaders agree that insights from social media data positively influence revenue and decision-making.
Conversion Metrics
Conversion metrics directly tie your campaign to measurable business outcomes. For example, Click-Through Rate (CTR) measures how many people who see your content actually click on it, while Conversion Rate reveals the percentage of those clicks that lead to actions like purchases, sign-ups, or downloads .
Other key metrics include Cost Per Acquisition (CPA), which tells you how much you're spending to gain each new customer or lead, and Return on Ad Spend (ROAS), which measures the revenue generated for every dollar spent on ads. Improving conversion rates can dramatically increase ROI - by as much as 223%.
Don’t forget to consider Customer Lifetime Value (CLV), which estimates the total revenue you can expect from a customer over the course of their relationship with your brand. Even if your CPA seems high initially, a strong CLV can justify the investment over time. A robust CRM system can help you connect campaign activity to these longer-term outcomes.
Next, let's look at behavioral metrics to understand what happens after users land on your website.
Behavioral Metrics
Behavioral metrics shed light on what users do once they visit your website. Bounce rate, for instance, measures the percentage of visitors who leave without interacting further. An excellent bounce rate falls between 26% and 40%, while anything above 70% may signal issues with engagement. Other useful metrics include average session duration and pages per session, which indicate how deeply visitors engage with your site .
Funnel drop-off points are another critical area to monitor. For example, if 500 people add items to their cart but only 150 complete the checkout process, you’ve identified a specific area to improve. Tools like Hotjar and Microsoft Clarity offer heatmaps and session recordings, helping you visualize where users click, scroll, and spend time. These insights can reveal navigation challenges and friction points .
Breaking down behavioral data by device type - such as mobile versus desktop - can also uncover platform-specific issues. Behavior flow reports are particularly helpful for pinpointing these differences. Keep in mind that mobile-optimized websites tend to achieve more than double the conversion rates of non-optimized ones .
Analyzing Behavior by Marketing Channel
Breaking down your analysis by channel can uncover unique audience behaviors: social media excels at driving engagement, email captures interest, and websites often lead to action.
It's also essential to separate organic from paid performance to better allocate budgets for future campaigns. As B2B Marketing Expert Daniel Clark points out:
"76% of consumers are more likely to make a purchase based on personalized experiences"
Channel-specific insights are key to delivering that level of personalization. Let’s explore each channel in detail.
Social Media Analysis
Leverage native analytics tools like Meta Business Suite, LinkedIn Analytics, TikTok Analytics, and YouTube Studio to track metrics such as reach, impressions, and interactions. Comparing content formats - like Reels versus Stories or carousel posts versus single-image posts - can help identify what resonates most with your audience.
Go deeper with sentiment analysis and social listening tools to understand brand perception. These tools can track hashtags, competitor mentions, and industry trends to provide a fuller picture of how your brand is perceived.
Audience segmentation by demographics such as age, gender, and location is another critical step. Since 74% of people use social media to guide purchasing decisions, identifying which groups engage most actively can help you refine your campaigns. To stay organized, track posting times and content performance in a spreadsheet, using green highlights for improvements and red for declines. This visual method makes it easier to spot trends and adjust strategies accordingly.
Once you’ve gathered insights from social media, the next step is analyzing email campaigns to understand subscriber engagement.
Email Campaign Analysis
Email marketing metrics like open rate and click-through rate (CTR) can reveal how well your content connects with subscribers. Crafting personalized subject lines can lead to impressive results: a 41.8% boost in open rates, a 14% increase in CTR, and 10% higher conversions.
Pay close attention to your unsubscribe rate, as spikes may signal that your messaging isn’t hitting the mark. Another valuable metric is Click-to-Open Rate (CTOR), which shows how engaging your content is for those who opened the email. This metric helps you assess whether the email delivered on the promise of its subject line.
Deliverability metrics like bounce rates (both hard and soft) and spam complaints are just as important. These factors directly affect your sender reputation, which can make or break your campaign’s success. Given that email marketing can yield an ROI of up to 4,400% - or $44 for every $1 spent - maintaining a clean email list by removing invalid addresses is crucial. Use these insights to fine-tune your segmentation and messaging in future campaigns.
With email engagement covered, turn your attention to website behavior and paid ad performance for a complete picture.
Website and Paid Ads Analysis
For website and paid ad tracking, Google Analytics 4 (GA4) is the go-to tool. UTM tagging, as discussed earlier, ensures accurate attribution of traffic and conversions. When you link Google Ads to GA4 with auto-tagging, detailed campaign data is automatically imported into your dashboard.
Use GA4’s custom reporting features, like Explorations, to analyze specific segments. For instance, compare mobile and desktop users or evaluate organic search traffic against paid campaigns. The "Pages and screens" report can highlight issues like 404 errors, which may be causing drop-offs in campaign traffic. Since organic search typically accounts for over 50% of online traffic, understanding how paid campaigns complement this is essential.
Attribution modeling helps determine which touchpoints contribute most to conversions. First-click attribution credits the initial channel that introduced users to your brand, while last-click focuses on the final interaction before conversion. For campaigns involving multiple touchpoints, linear or time-decay models provide a more balanced view. Tools like heatmaps and session recordings (e.g., Hotjar) offer additional insights by showing exactly where users click, scroll, or lose interest. These insights can guide you in optimizing your landing pages and user flows for better performance in future campaigns.
Using Advanced Analysis Techniques
To truly understand what drives your campaign's success, you need to go beyond basic metrics. It's not just about knowing what happened - it's about uncovering the why and figuring out how to replicate those results. Advanced analysis techniques can help you dig deeper into audience behavior and fine-tune your strategies.
By 2026, a surprising 67% of B2B marketing teams still rely on last-touch attribution, which often leads to budget misallocations. This is a major issue because the average B2B buyer interacts with over 27 touchpoints during an extended sales cycle. In contrast, companies using multi-touch attribution have seen a 19% boost in marketing ROI within just one year. The challenge lies in selecting the right analysis method and ensuring your data infrastructure can support it.
Multi-Touch Attribution
Multi-touch attribution (MTA) assigns credit to every interaction along the customer journey, giving you a complete picture of how conversions happen. Unlike last-touch models, which focus only on the final step, MTA highlights the value of early and mid-funnel activities. This approach helps identify "gateway pages" (key entry points) and "influencer pages" (those that guide users through the funnel) that are often overlooked.
Last-touch models tend to over-credit bottom-of-funnel channels like branded search or retargeting, undervaluing the channels that create awareness. To address this, start with a baseline model like linear or U-shaped attribution. Linear models divide credit equally across all touchpoints, offering a straightforward perspective. For businesses handling 300+ conversions per month, data-driven attribution uses machine learning to assign credit based on each touchpoint's statistical impact.
| Attribution Model | Credit Distribution | Best Use Case |
|---|---|---|
| Last-Click | 100% to the final interaction before conversion | Short sales cycles or impulse purchases |
| Linear | Equal credit distributed across all touchpoints | Teams transitioning from single-touch models |
| Data-Driven | Machine learning assigns credit based on impact | High-volume businesses with 300+ conversions/month |
Custom MTA models can increase ROI measurement accuracy by 15–25% compared to standard models, but they require careful calibration. For instance, adjusting lookback windows (30, 60, or 90 days) to match your sales cycle is crucial.
"Google Analytics only lets you compare data from 90 days prior to conversion, making it obsolete for longer sales cycles, ongoing comparisons, and historical comparisons."
– Mark Sullivan, Director of Demand Generation, CallRail
Once you've allocated credit across touchpoints, you can dive into behavior patterns using cohort analysis.
Cohort Analysis
Cohort analysis groups users based on shared traits, like signup date or specific actions, to track their behavior over time. This method reveals trends that aggregate data might miss.
For example, you can group users by their signup date (acquisition cohorts) or by specific actions they take (behavioral cohorts). Acquisition cohorts help you measure how customer quality changes over time, while behavioral cohorts reveal which actions lead to long-term value.
A key metric to watch is the retention plateau, where the retention curve levels off after an initial drop. This is often a sign of product-market fit. As KISSmetrics notes:
"A 25% retention rate that is improving by two percentage points per month is more promising than a 40% rate that is declining."
– KISSmetrics Editorial
For most small businesses, weekly data strikes the right balance - daily data can be too noisy, while monthly intervals might delay insights. Look for sharp drops in retention (e.g., between days 7–14) to time re-engagement efforts like emails or in-app notifications. You can also use UTM parameters to segment cohorts by campaign, helping you identify which ads attract loyal customers versus one-time clickers.
A great example comes from Spearmint LOVE, an online clothing retailer. In 2015–2016, they used cohort analysis to study purchasing patterns among mothers at different pregnancy stages. By timing their ad campaigns to match these patterns, they achieved an incredible 991% year-over-year growth.
Incrementality Testing
While attribution models can show where credit goes, incrementality testing answers a different question: Did your campaign actually drive additional sales, or would those conversions have happened anyway? Incrementality testing uses controlled experiments to measure your campaign's true impact.
This method is becoming increasingly important. By 2025, 73% of marketing leaders considered incrementality testing essential, up from 41% in 2023. Without it, brands waste an average of 23% of their marketing budget on activities that don't drive incremental results.
Incrementality testing is especially useful for high-intent channels like branded search and retargeting, where customers might convert without seeing an ad. For instance, a major CPG brand in 2025 used incrementality testing to reassess its TV advertising. Traditional attribution models credited TV with 35% of conversions, but testing revealed it only drove 8% in incremental sales. This insight led to a $2.3 million budget reallocation and a 31% boost in overall marketing ROI.
To get started, run tests for 4–6 weeks to cover the full customer lifecycle. Focus on your highest-budget channel first to maximize potential ROI gains. Make sure your sample size is large enough - typically between 5,000 and 50,000 users per group - to detect meaningful trends.
"Incrementality testing for marketing campaigns has evolved from a luxury for large advertisers to an essential practice for any brand serious about marketing ROI."
– InfluenceFlow
You can use built-in tools from platforms like Meta or Google Ads, though these often require allocating 10–30% of your budget to control groups. Alternatively, third-party tools like Measured, Recast, and Northbeam offer more flexibility but can cost $5,000 to $50,000 or more per month. The best approach combines incrementality testing for strategic insights with attribution models for day-to-day execution.
Turning Analysis into Action
Taking your analysis to the next level means translating insights into actionable strategies. Gathering data and running advanced analyses is just the first step. The real payoff comes when those insights fuel meaningful changes that improve your campaigns and drive results. Without a clear plan, even the most detailed data remains just numbers on a screen.
Spot Trends and Patterns
Start by breaking down your audience data to uncover which groups contributed most to your campaign's success. Segment by demographics like age, gender, or location, as well as by device type (mobile vs. desktop) and traffic source. For instance, you might find that users coming from paid social channels behave differently from those arriving through organic search.
Next, take a closer look at where users drop off in your funnel. Are they leaving at the landing page, during form submissions, or at checkout? Pinpointing these friction points is key to identifying opportunities for improvement.
To get a clearer picture of your bottom line, calculate your true profit by subtracting costs like discounts, ad spend, and operational expenses from your total revenue. As Muhammed Tüfekyapan, Founder of Growth Suite, puts it:
"Revenue is the most dangerous metric in holiday marketing when measured alone."
Also, compare campaign results to your baseline metrics. Look at conversion rates during non-campaign periods to determine if your efforts are driving new growth or just speeding up existing demand. This helps you measure the actual impact of your marketing.
Finally, evaluate brand sentiment using social listening tools. Engagement numbers alone won’t tell you if your campaign resonated positively or sparked backlash. Qualitative insights provide the context you need to refine your messaging and improve future strategies.
Apply Findings to Future Campaigns
Use these insights to make immediate adjustments. For example, tweak your content strategy based on engagement metrics like session duration and page views. If certain topics keep users engaged longer, focus on those while phasing out underperforming content.
Address bottlenecks in your funnel by refining conversion paths. If your analysis shows significant drop-offs at specific steps, work on simplifying those processes. Keep in mind that mobile-optimized websites can achieve more than double the conversion rates of non-optimized ones.
Reallocate resources toward high-performing channels based on attribution data. For instance, if your email campaigns are delivering strong click-through rates - typically between 2% and 5% - but other channels are lagging, shift your budget accordingly. Businesses that prioritize conversion rate optimization can see up to 223% higher ROI.
After each campaign, create a one-page retrospective. Document what went well, what didn’t, and actionable steps for improvement. Over time, these retrospectives become a valuable resource, offering unique insights to guide future campaigns.
Don’t forget: 80% of consumers are more likely to engage with brands that deliver personalized experiences. Use behavioral segmentation - not just demographics, but also motivations and habits - to craft targeted messaging that resonates with each audience segment.
Work with SEO Werkz

To turn insights into impactful strategies, consider working with experts who specialize in data-driven marketing. SEO Werkz provides dedicated account managers to develop custom strategies focused on ROI.
As a full-service agency, SEO Werkz covers SEO, social media, PPC, content creation, web design, and retargeting. They integrate data from all touchpoints into a unified approach, bridging gaps between sales, social media, and finance teams for a complete view of campaign performance.
The agency places a strong emphasis on Conversion Rate Optimization (CRO), ensuring that your traffic translates into measurable results. They also employ advanced tools like CallRail for call tracking, linking digital campaigns to offline outcomes.
Recognized by The Manifest as one of Salt Lake City’s top-reviewed marketing agencies in April 2022, SEO Werkz has a proven record of turning analysis into real business improvements. From optimizing search metadata to fine-tuning social media strategies, their expertise can help you take your campaigns to the next level.
Conclusion
Post-campaign audience behavior analysis goes beyond just crunching numbers - it lays the groundwork for smarter, more effective marketing strategies. Every campaign tells a story through its data, unveiling the motivations behind customer actions and transforming marketing efforts into a more precise, repeatable process.
Consider this: companies that rely on data are 23 times more effective at acquiring customers, 19 times more likely to maintain profitability, and can see up to a 223% boost in ROI by leveraging behavioral insights. These aren't small wins; they're the kind of results that distinguish successful businesses from those stuck in guesswork.
By following the steps outlined earlier, you can chart a clear path forward. Start by gathering accurate data from all your channels. Focus on meaningful metrics like engagement, conversions, and behavioral trends. Dive deeper into your analysis with tools like multi-touch attribution and cohort analysis. Then, act on those insights - refine your targeting, address bottlenecks, and shift resources toward tactics that deliver the best results.
This approach aligns with the wisdom of industry leaders. As Steve Jobs famously said:
"Marketing is about values. It's a complicated and noisy world... we have to be really clear about what we want them to know about us".
Post-campaign analysis provides that clarity. It reveals which messages hit the mark, which channels performed best, and where your audience experience needs improvement.
To maintain this strategic advantage, make post-campaign analysis a consistent part of your process. Share insights with your team, update buyer personas with real-world data, and treat each campaign as a stepping stone for the next. This cycle of continuous learning and refinement strengthens your marketing efforts over time.
FAQs
Which post-campaign metrics should I prioritize first?
Tracking metrics like reach, impressions, engagement (including click-through rate, likes, shares, and comments), conversions, and ROI is key. These numbers tell you how far your campaign reached, how your audience responded, and whether it achieved its goals. Focusing on these insights helps you measure success, pinpoint areas to tweak, and make smarter, data-backed decisions for your next campaign.
How do I validate my tracking data is accurate?
To keep your tracking data reliable, it’s essential to audit your analytics setup regularly. Start by reviewing your tracking configurations to spot any gaps or errors. Make sure events and conversions are firing as expected, and double-check that traffic sources are being attributed correctly. Routine checks for inconsistencies will help you maintain dependable insights, which are key for making smarter decisions.
When should I use attribution vs incrementality testing?
Attribution testing is all about figuring out how credit is distributed across different marketing channels based on user interactions. It highlights which channels are driving conversions. That said, it can sometimes lean toward giving too much credit to paid campaigns.
On the other hand, incrementality testing digs deeper. It measures the actual impact of your campaign by isolating the conversions that happened because of your efforts. This is done through controlled experiments, using test and control groups, to give you a more accurate view of what’s really working.